
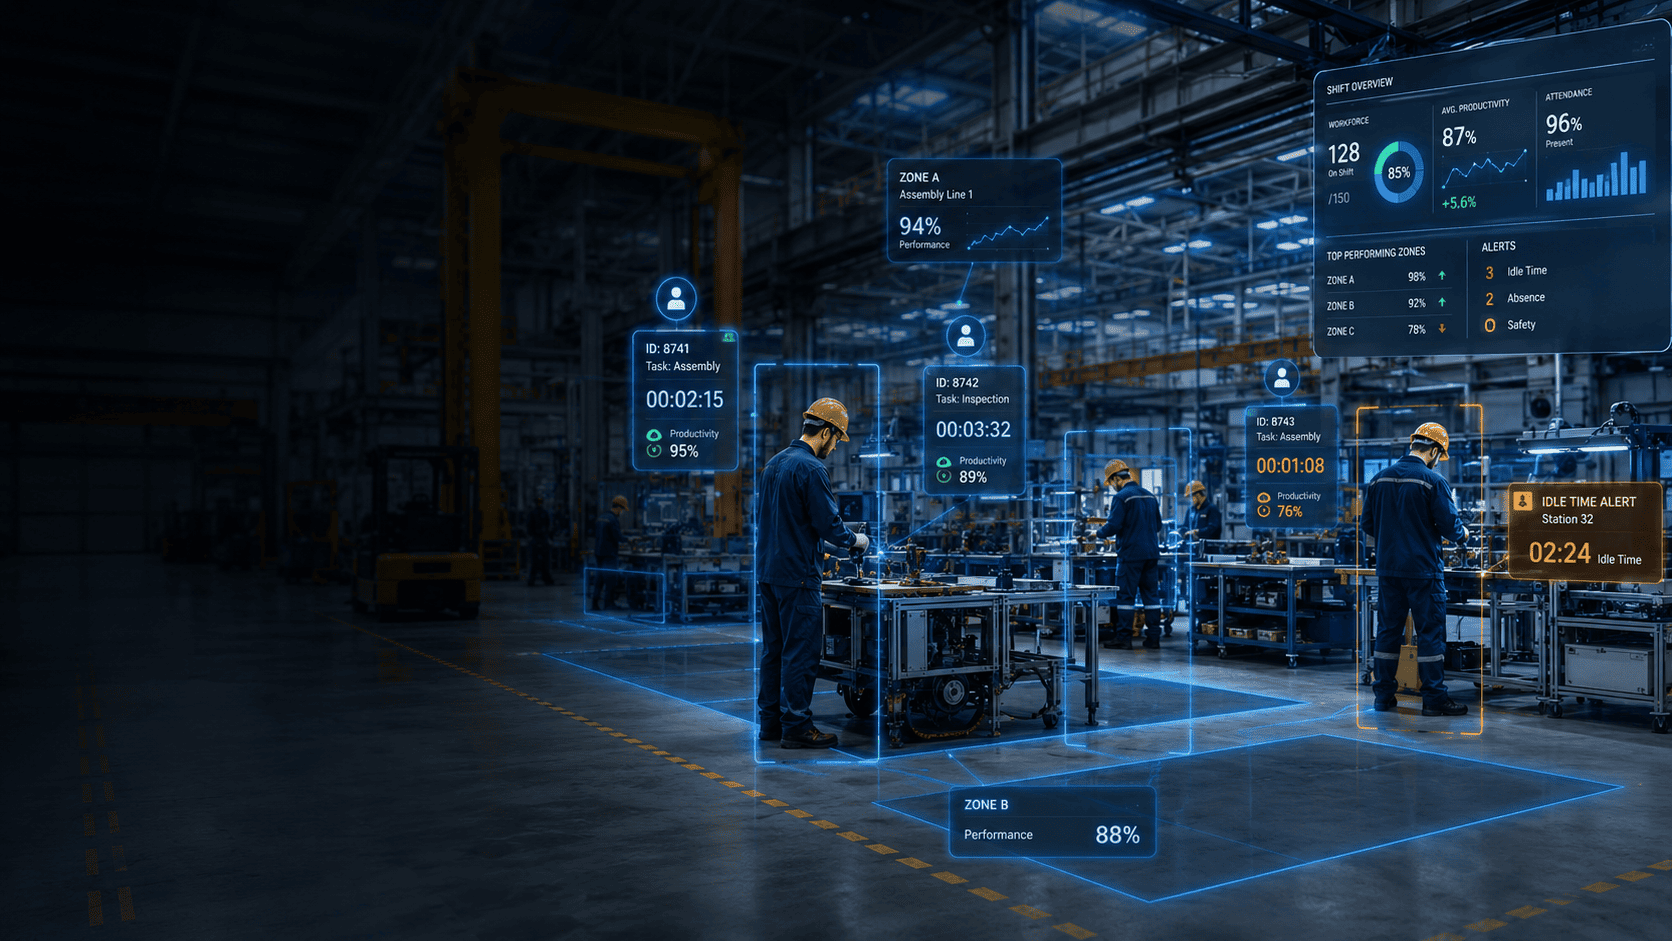
AI հարթակ՝ աշխատակիցների ներկայության, գործողությունների ժամանակաչափման, պարապուրդների, երթուղիների, կարգապահության, գոտիների բեռնվածության և KPI-ների օբյեկտիվ վերահսկման համար։ Համակարգը իրադարձությունները միավորում է մեկ վերլուծական շերտում՝ արտադրության ղեկավարների, անվտանգության ծառայության և օպերացիոն թիմերի համար։
Ղեկավարը հաճախ տեսնում է հերթափոխի արդյունքը արդեն հետո, իսկ կորուստների պատճառները թաքնված են մանր պարապուրդների, սպասումների, ավելորդ շարժումների և կանոնների խախտումների մեջ։
Downtime, waiting, distractions and inactivity accumulate quietly but directly affect output and deadlines.
Work assessment relies on walkarounds, spot checks and subjective shift reports.
Even good rules are followed differently across shifts, workshops, branches and contractors.
A line may stop because of missing people, materials, equipment, permission, checks or route errors.
Phones, smoking, excessive talks, crowding, leaving the workplace and bypassing restricted zones are detected too late.
Without an event archive it is hard to prove deviations, motivate staff fairly and improve processes.
Ինչպես արդյունաբերական անվտանգության հարթակում, այստեղ էլ տրամաբանությունը “մինչ / հետո” է՝ քիչ ձեռքի վերահսկում, ավելի շատ իրադարձություններ, չափումներ և գործողություններ։
The shift is analyzed after the fact; part of violations and downtime never reaches reports.
Managers cannot see where people, equipment or lines actually stay idle.
Reports take time, figures conflict and are not always supported by facts.
Cameras automatically capture events, timing and deviations across key zones.
Heatmaps, routes, zones, shifts and stations show actual workload of the site.
Metrics, events, frames and reports are available for management, QA, production and security.
Սցենարները կարելի է միացնել փուլերով՝ ներկայություն և պարապուրդներ, հետո երթուղիներ, կարգապահություն, արտադրական օպերացիաներ, անվտանգություն և ոլորտային դեպքեր։
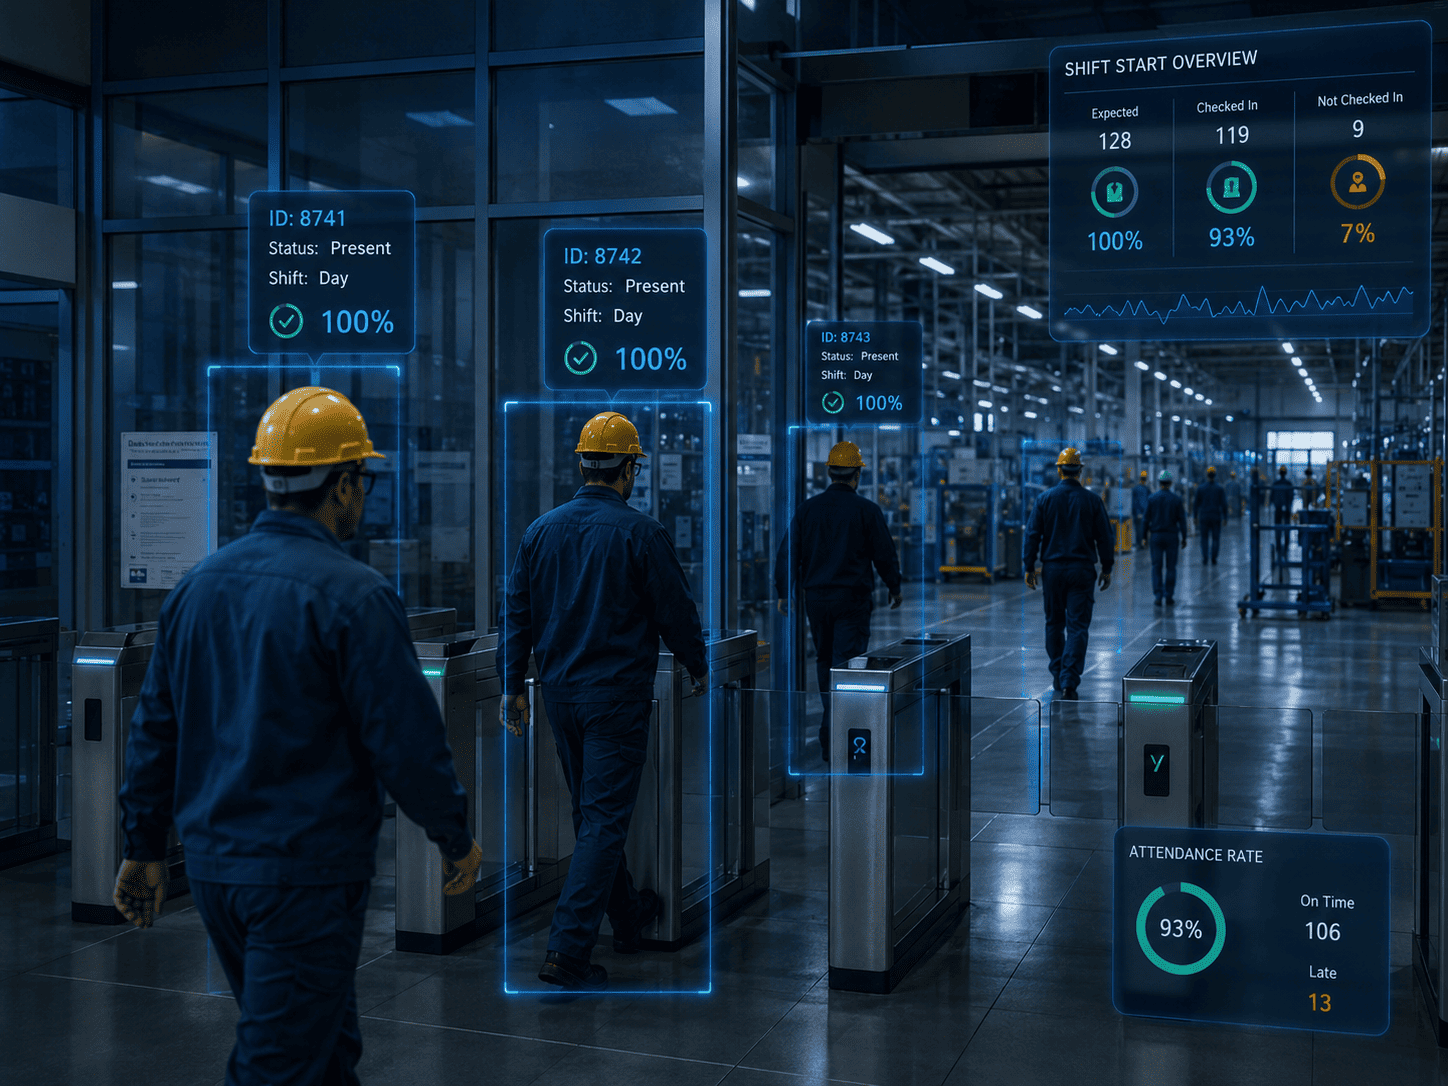
Check-in, check-out, absence, early leaving, lateness, presence in work zones and actual shift workload.
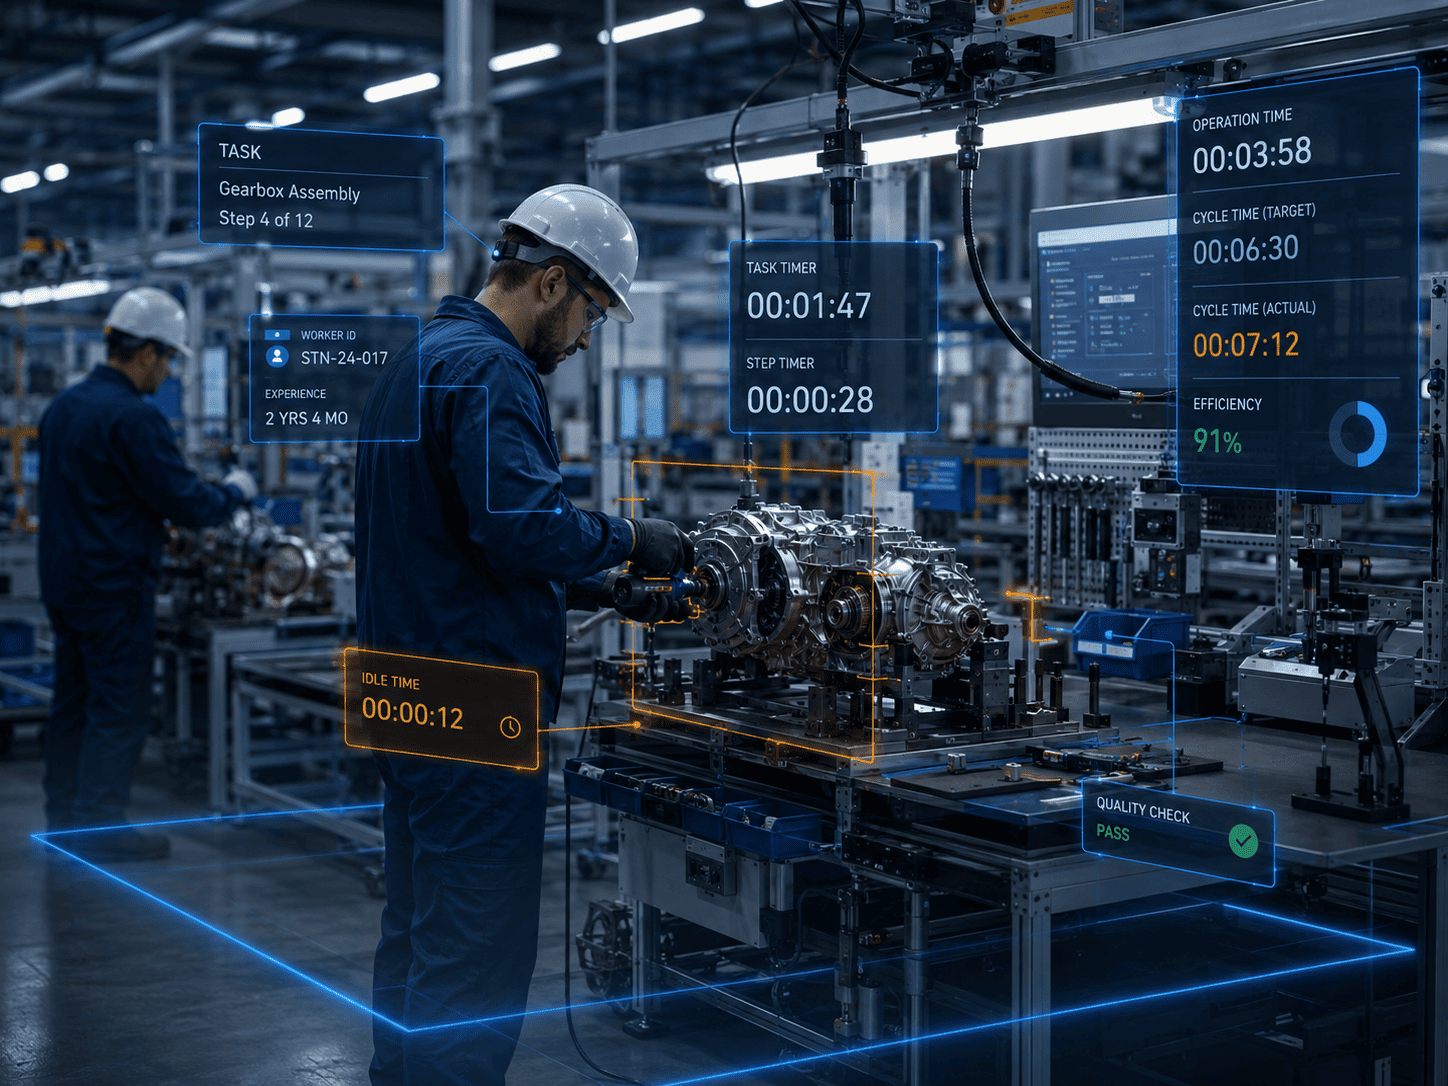
Measuring time of repeated operations, cycles, assembly stages, material waiting and deviations from standard time.
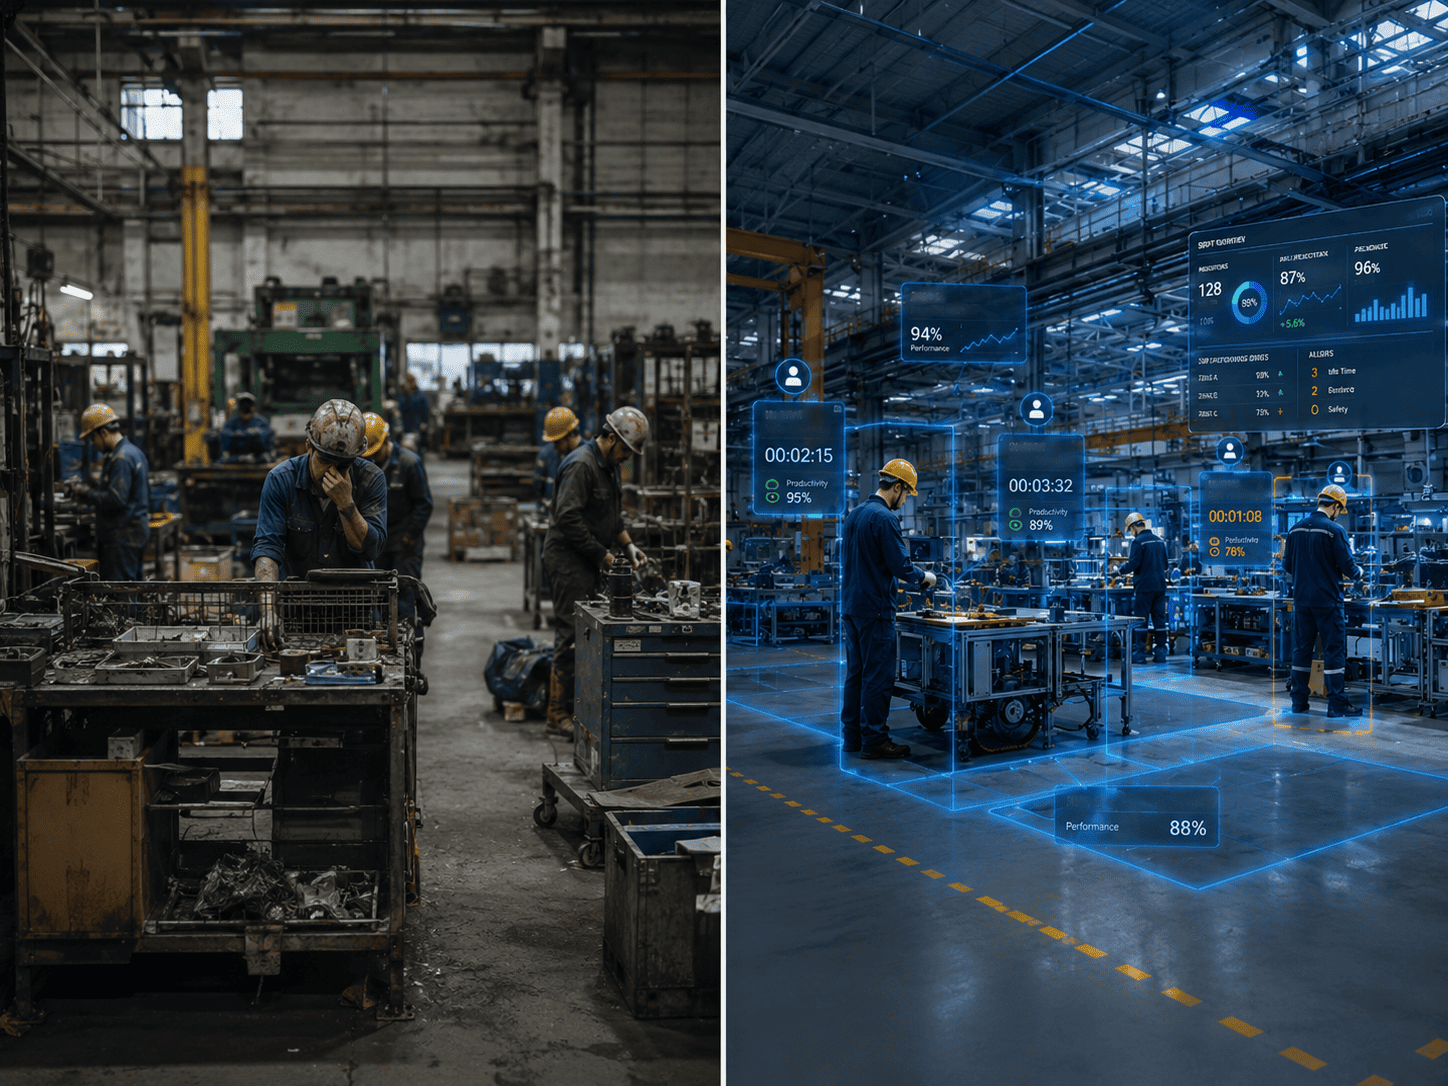
Detecting idle time, inactivity, waiting, downtime of teams, operators, equipment and production stations.
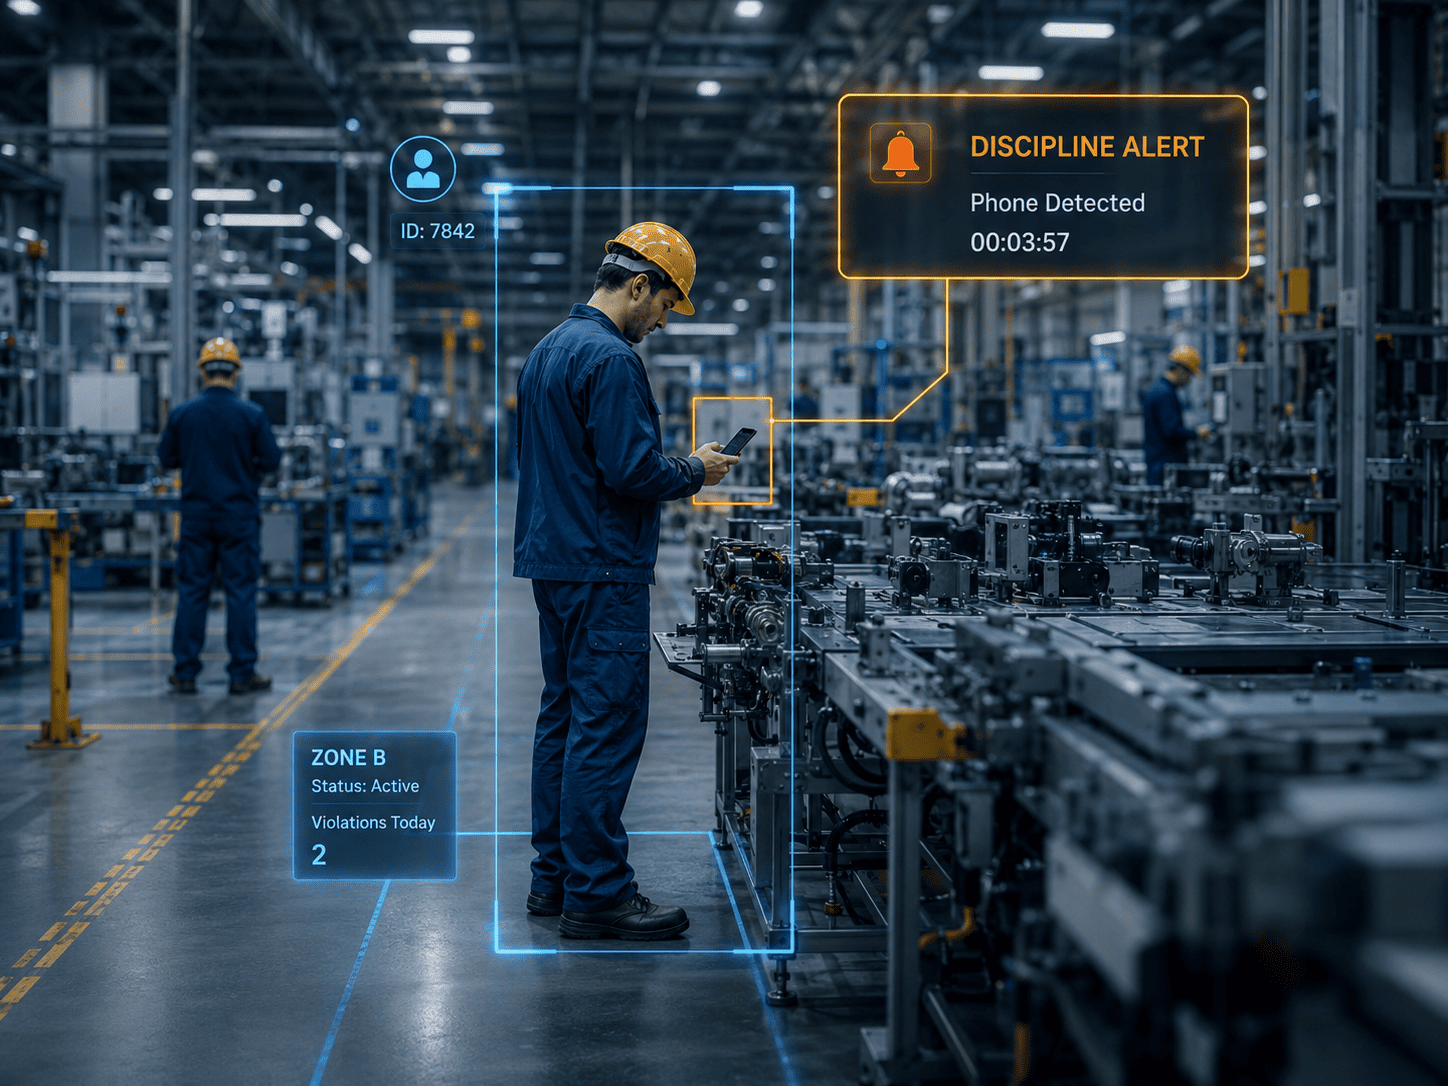
Detection of phone use, long conversations, distractions, smoking, procedure and discipline violations in work zones.
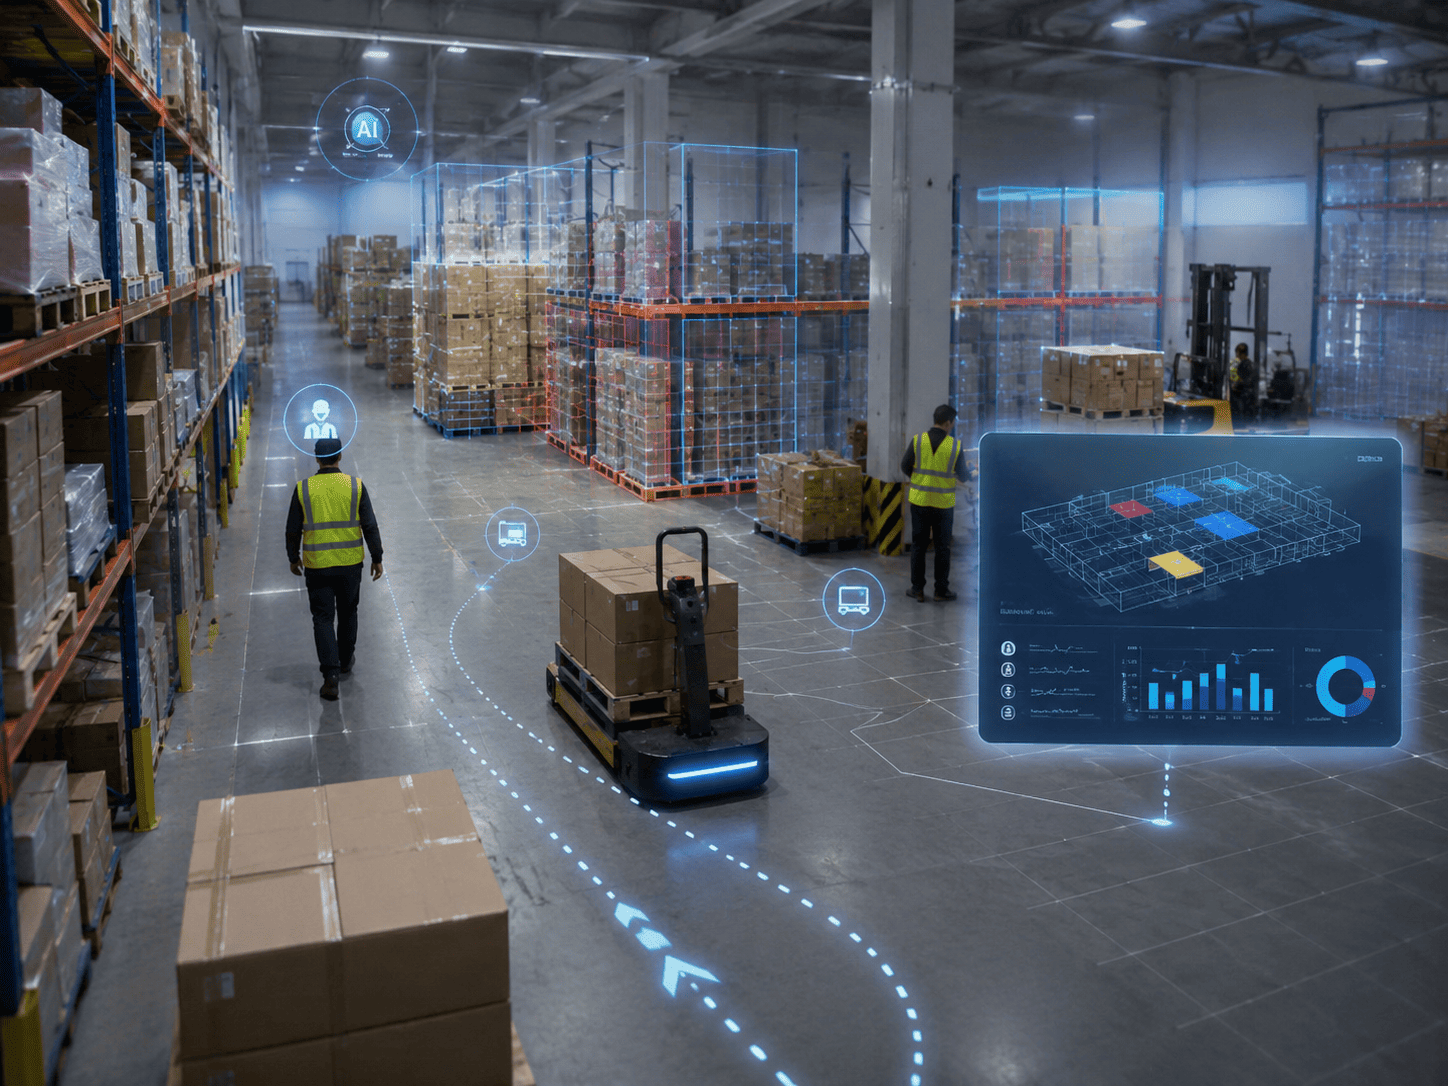
Multi-camera route reconstruction, rounds control, time in zones and inefficient movement patterns.
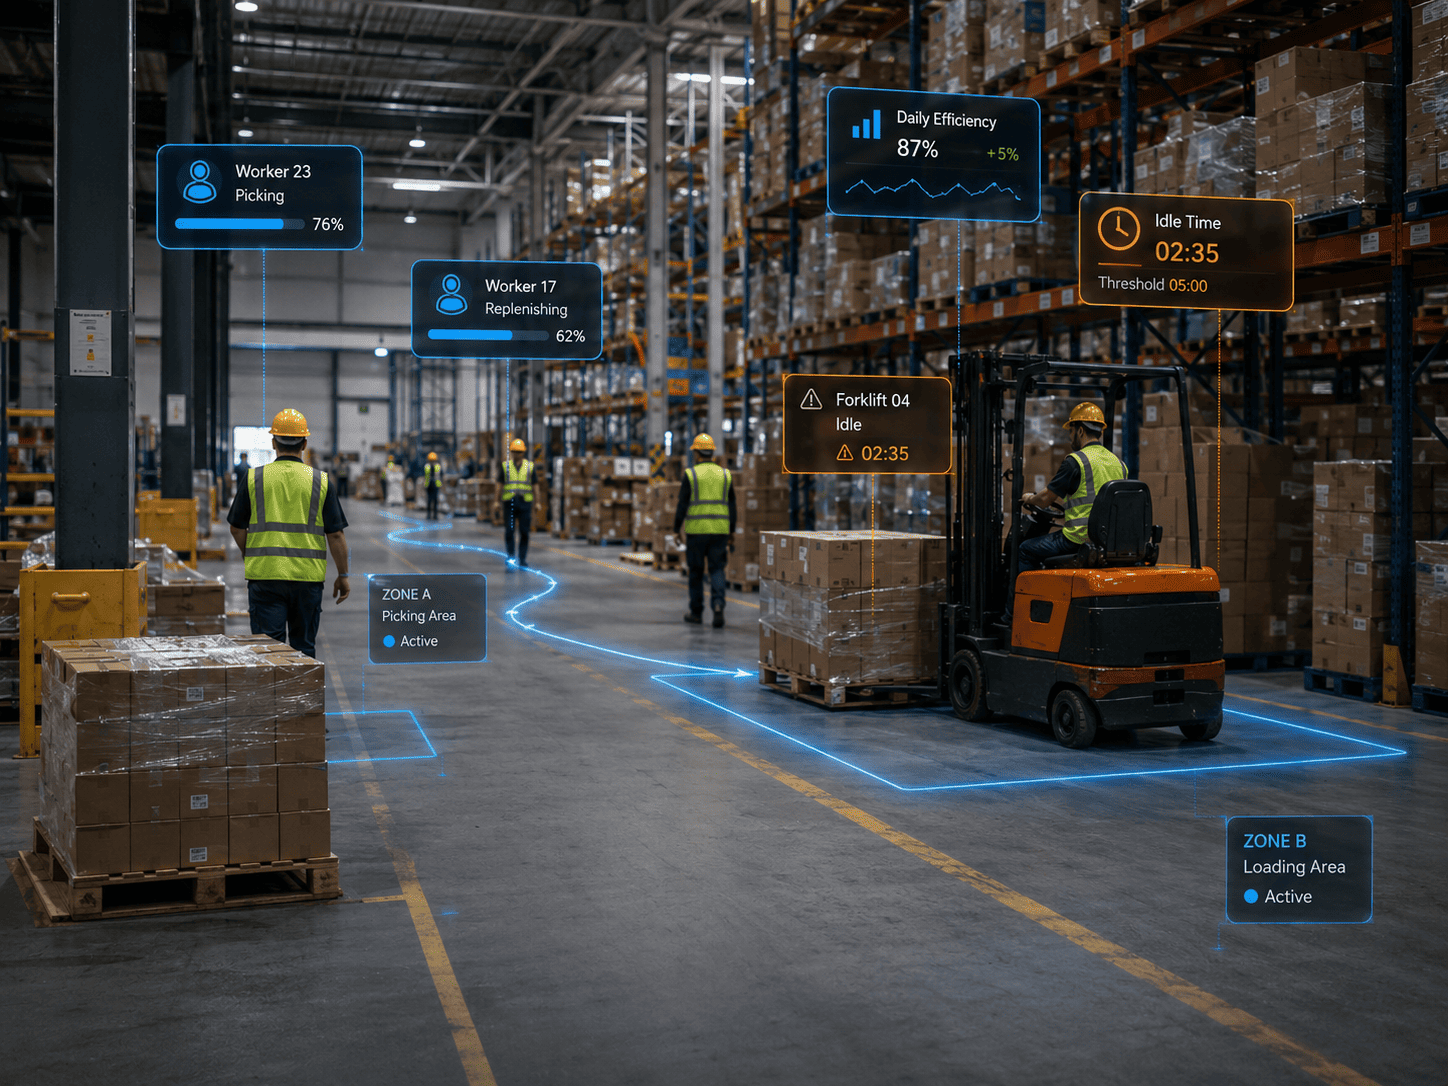
Detection of crowding, conflicts, queues, overloaded areas, bottlenecks and order violations.
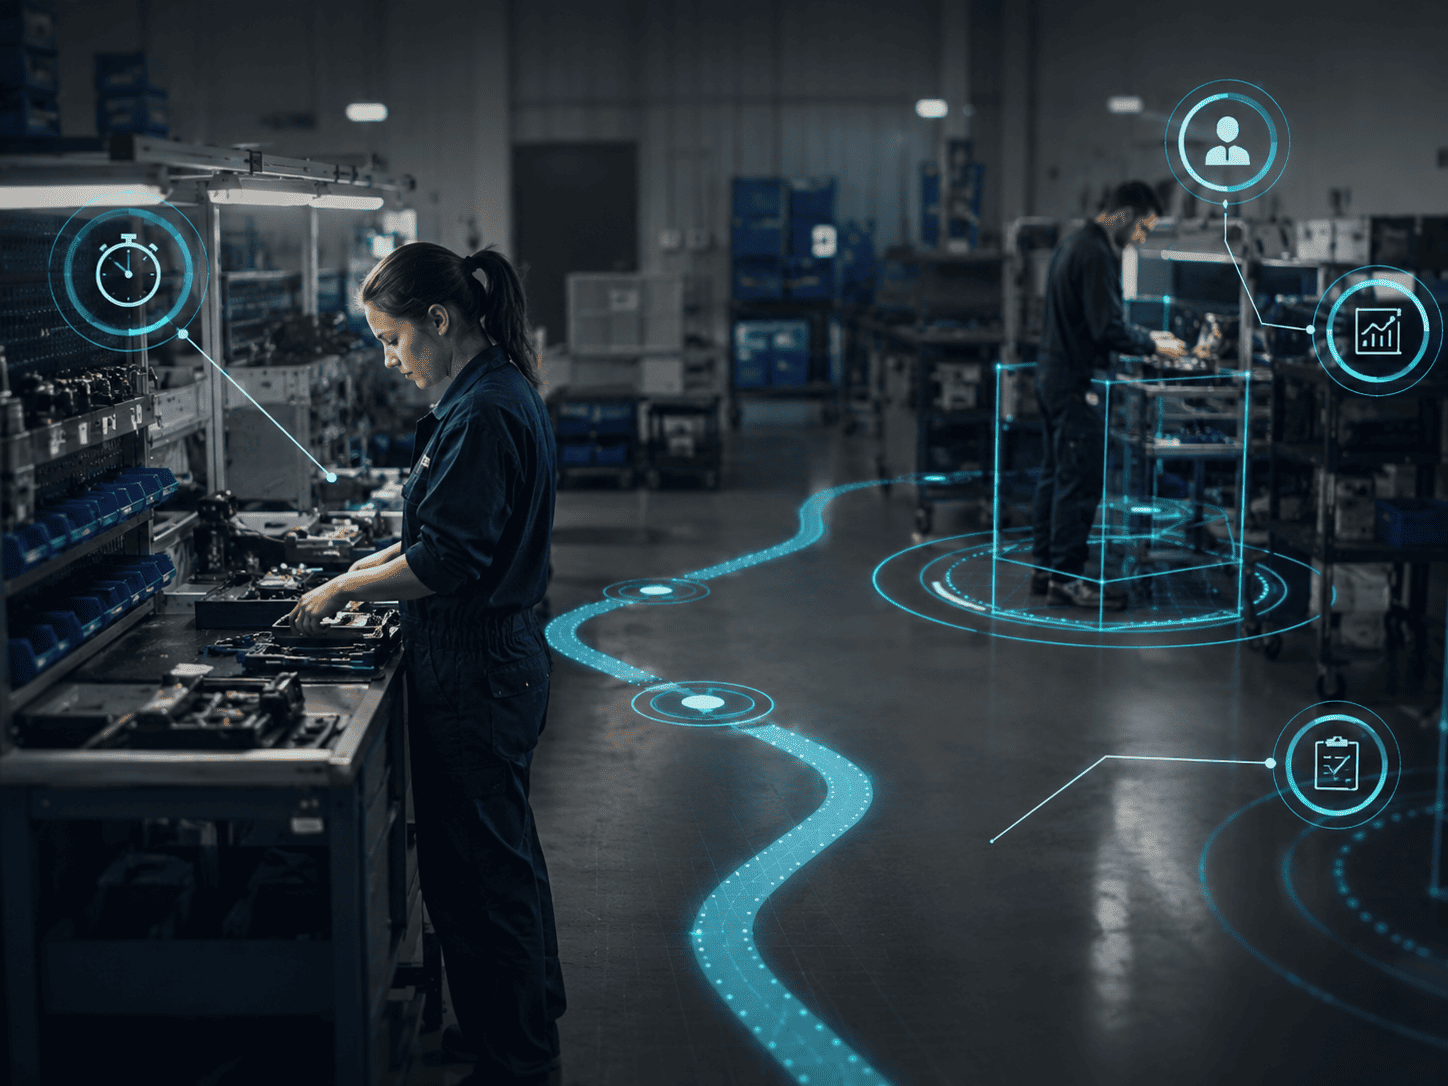
Control of actual presence, workload, routes, rule compliance and task duration for contractors.
Bulldozer, loader, crane and excavator work analysis, machinery movement, unloading and actual work time.
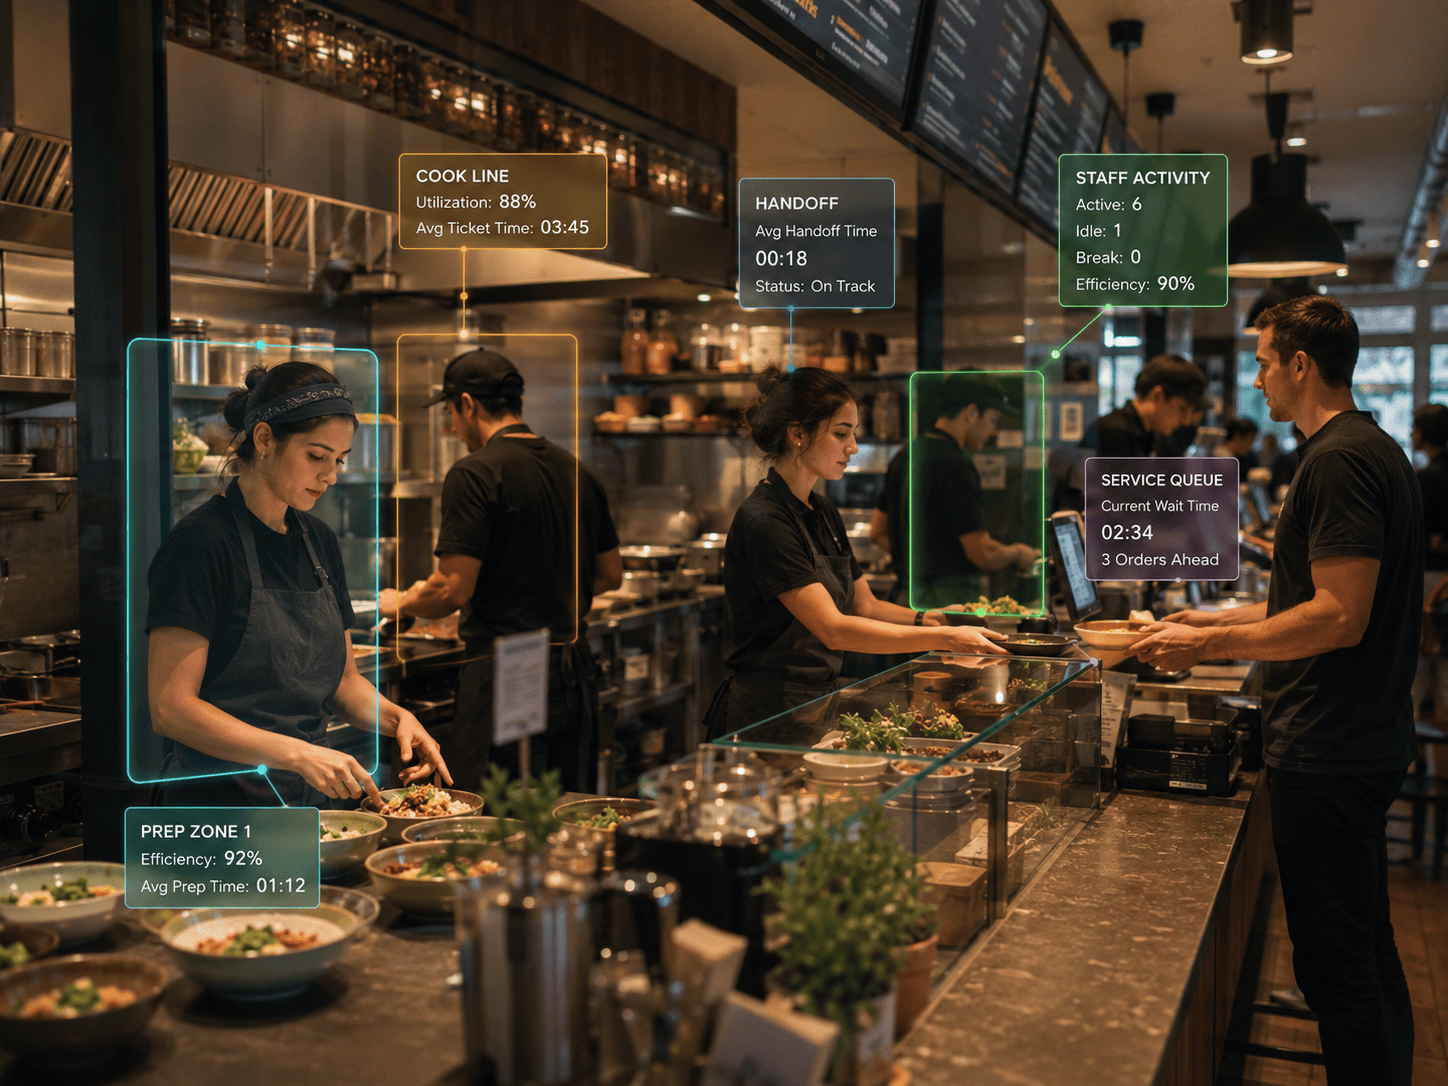
Kitchen workload, handoff speed, waiting, queues, idle staff, standard violations and service quality.
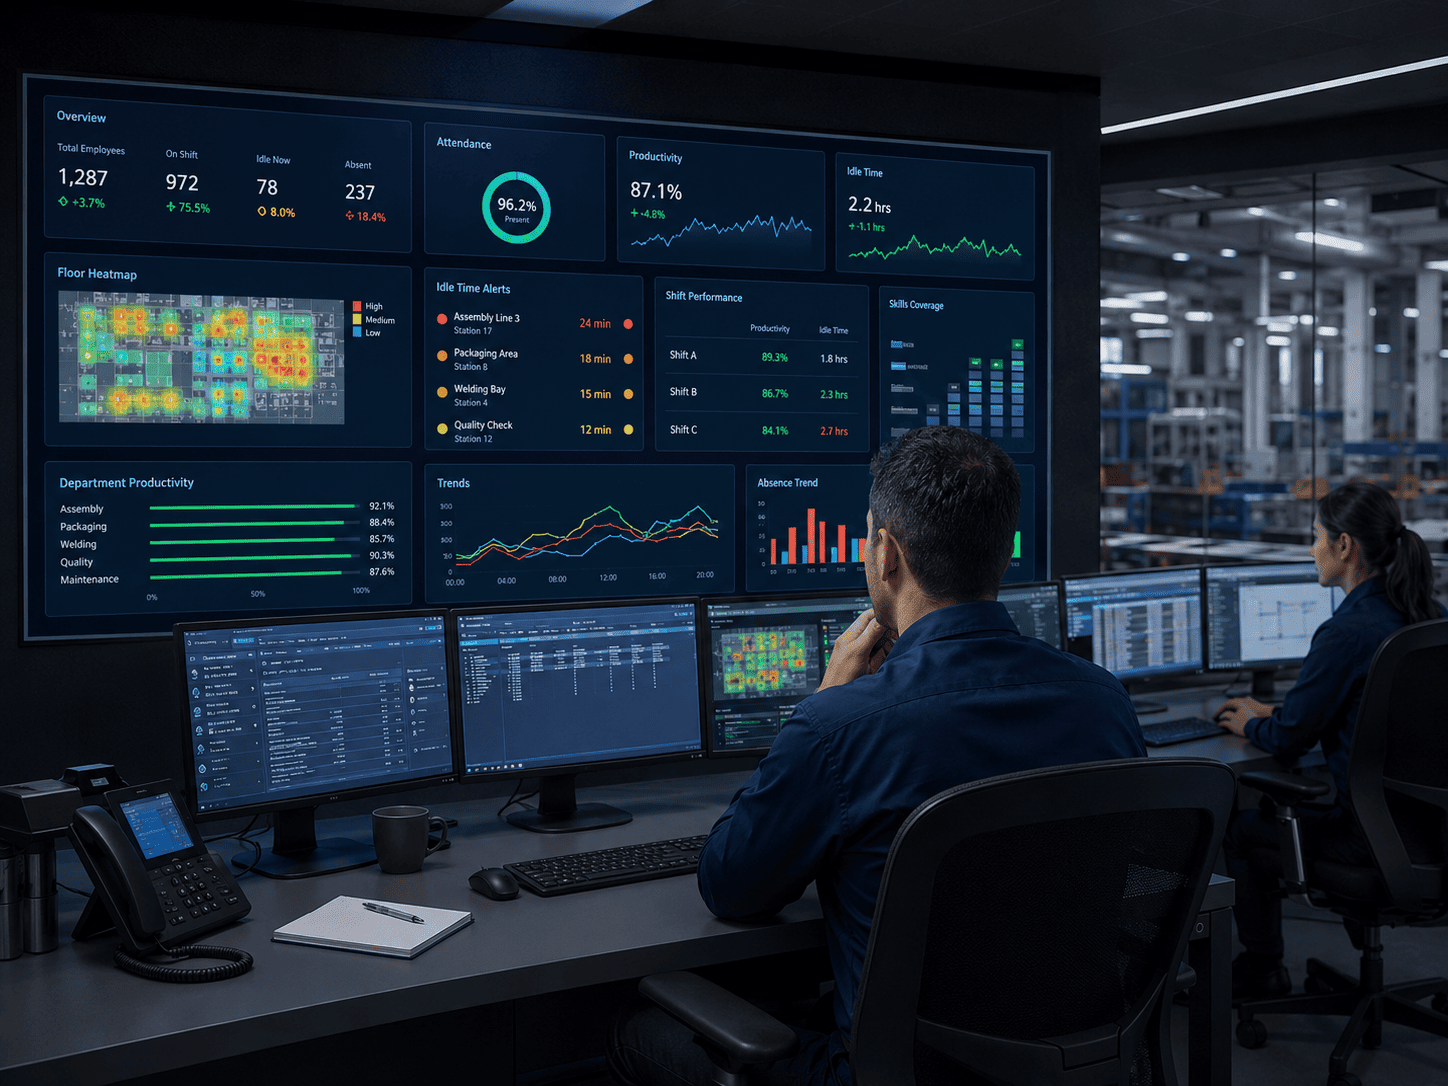
Dashboards by shifts, zones, roles, employees, deviation causes and objective efficiency evaluation.
Նույն հարթակը աշխատում է արտադրամասում, պահեստում, շինհրապարակում, ռեստորանում, գրասենյակում, դիսպետչերական կենտրոնում և տրանսպորտային ենթակառուցվածքում։
Operation timing, station workload, idle time, action control, downtime, rework and process sequence compliance.
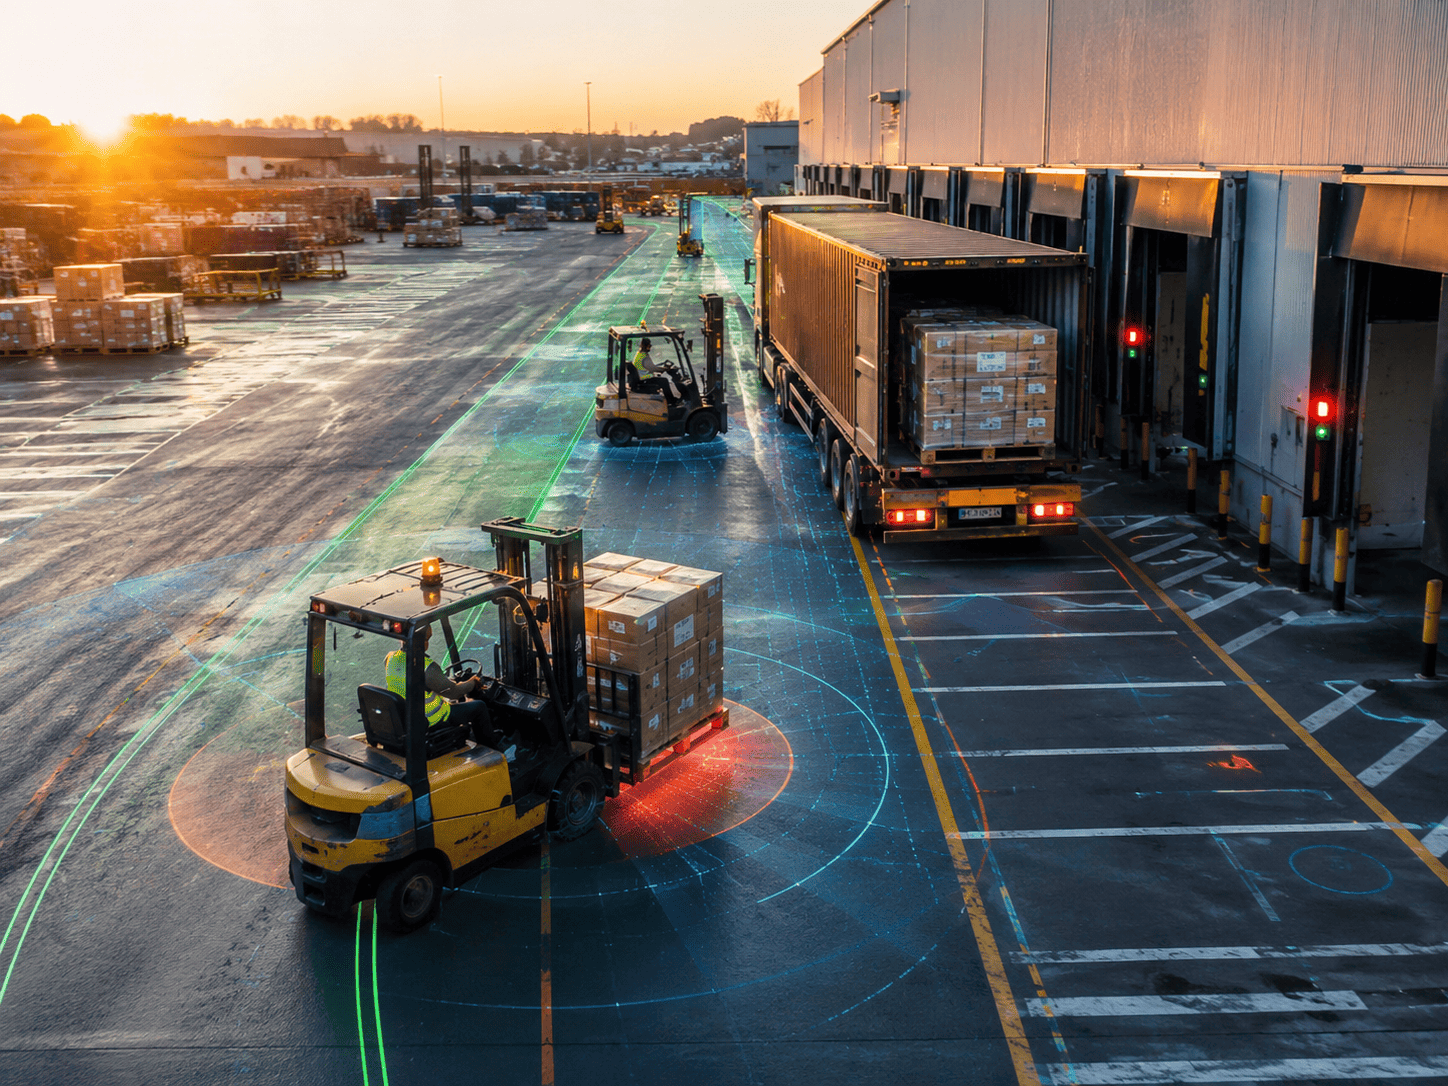
Picking, placement, loading and unloading, forklift work, staff and equipment movement, downtime and route control.
Control of teams, equipment, rigging, under-load zones, dangerous areas, contractor presence and work stages.
Kitchen workload, handoff speed, waiting, queues, idle staff, standard violations and service quality.
Presence, work zone activity, meeting rooms, team workload, discipline and office productivity.
Operators, shifts, dispatchers, inspection rounds, incident handling, workload and staff discipline.
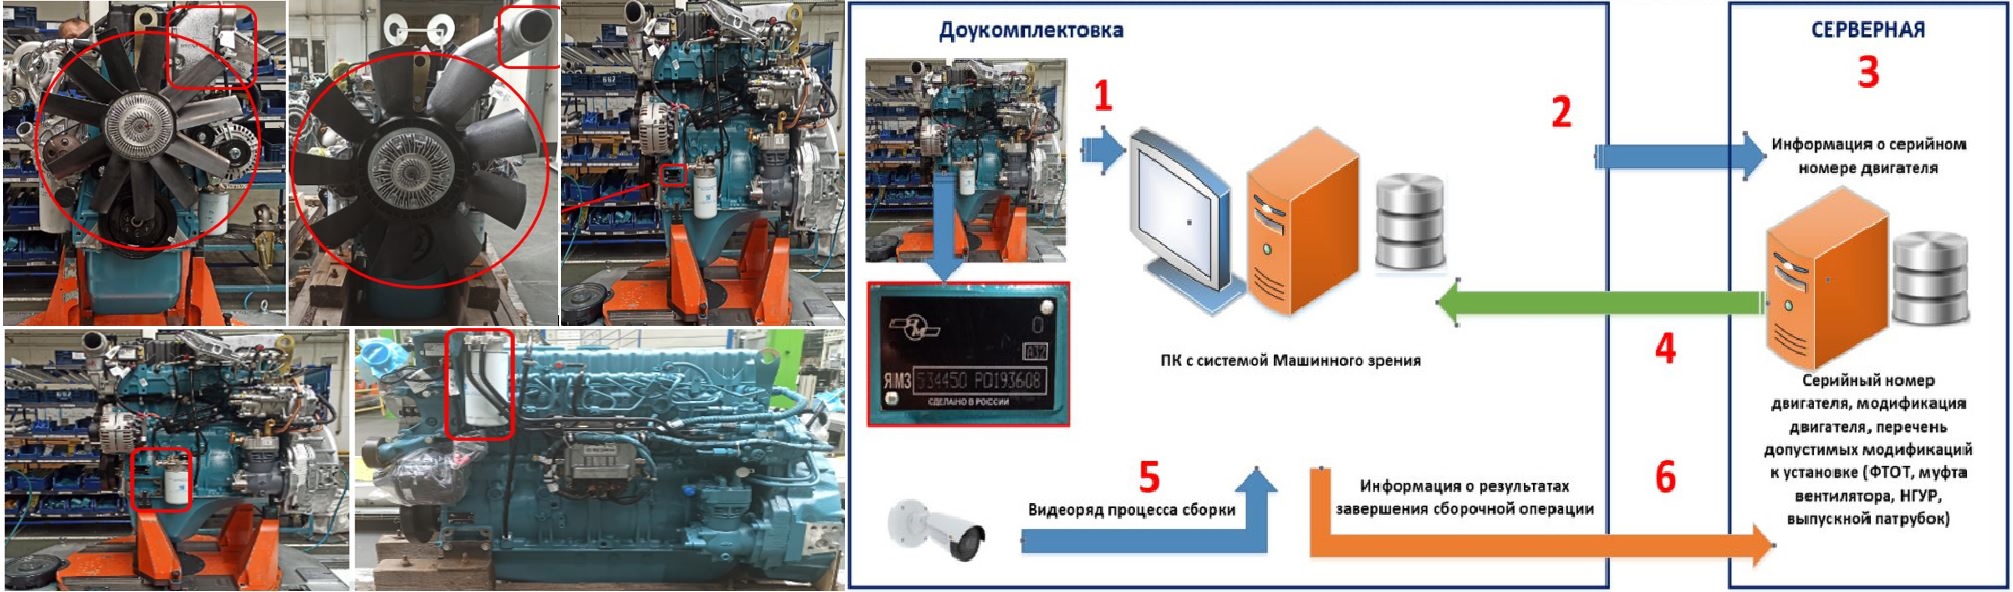
Հավաքման, գործողությունների հաջորդականության, փուլերի բացթողումների, աշխատանքի տեմպի և շեղումների վերահսկում։
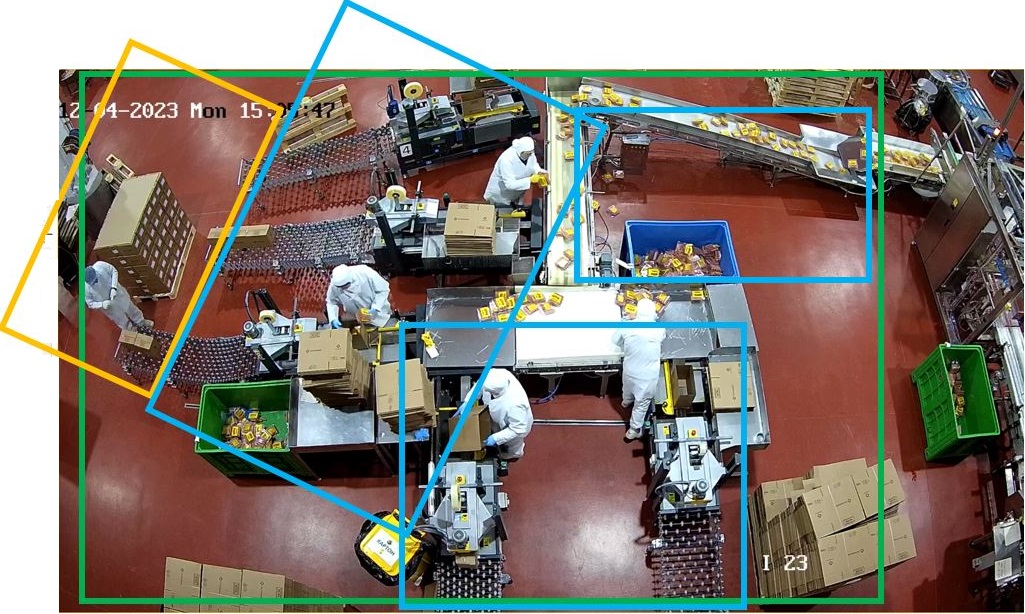
Ժամանակի վերահսկում գոտիներում, սահմանների խախտումներ, աշխատակիցների երթուղիներ և միջխցիկային թրեքինգ։
Գոտիների վերլուծություն, թրեքինգ, ժամանակաչափում, գործողությունների վերահսկում, գործընթացների մոնիթորինգ և տեխնիկայի աշխատանքի վերլուծություն իրական արտադրական սցենարներում։
Աշխատանքային, ծառայողական և սահմանափակ գոտիներում գտնվելու ժամանակի վերահսկում։
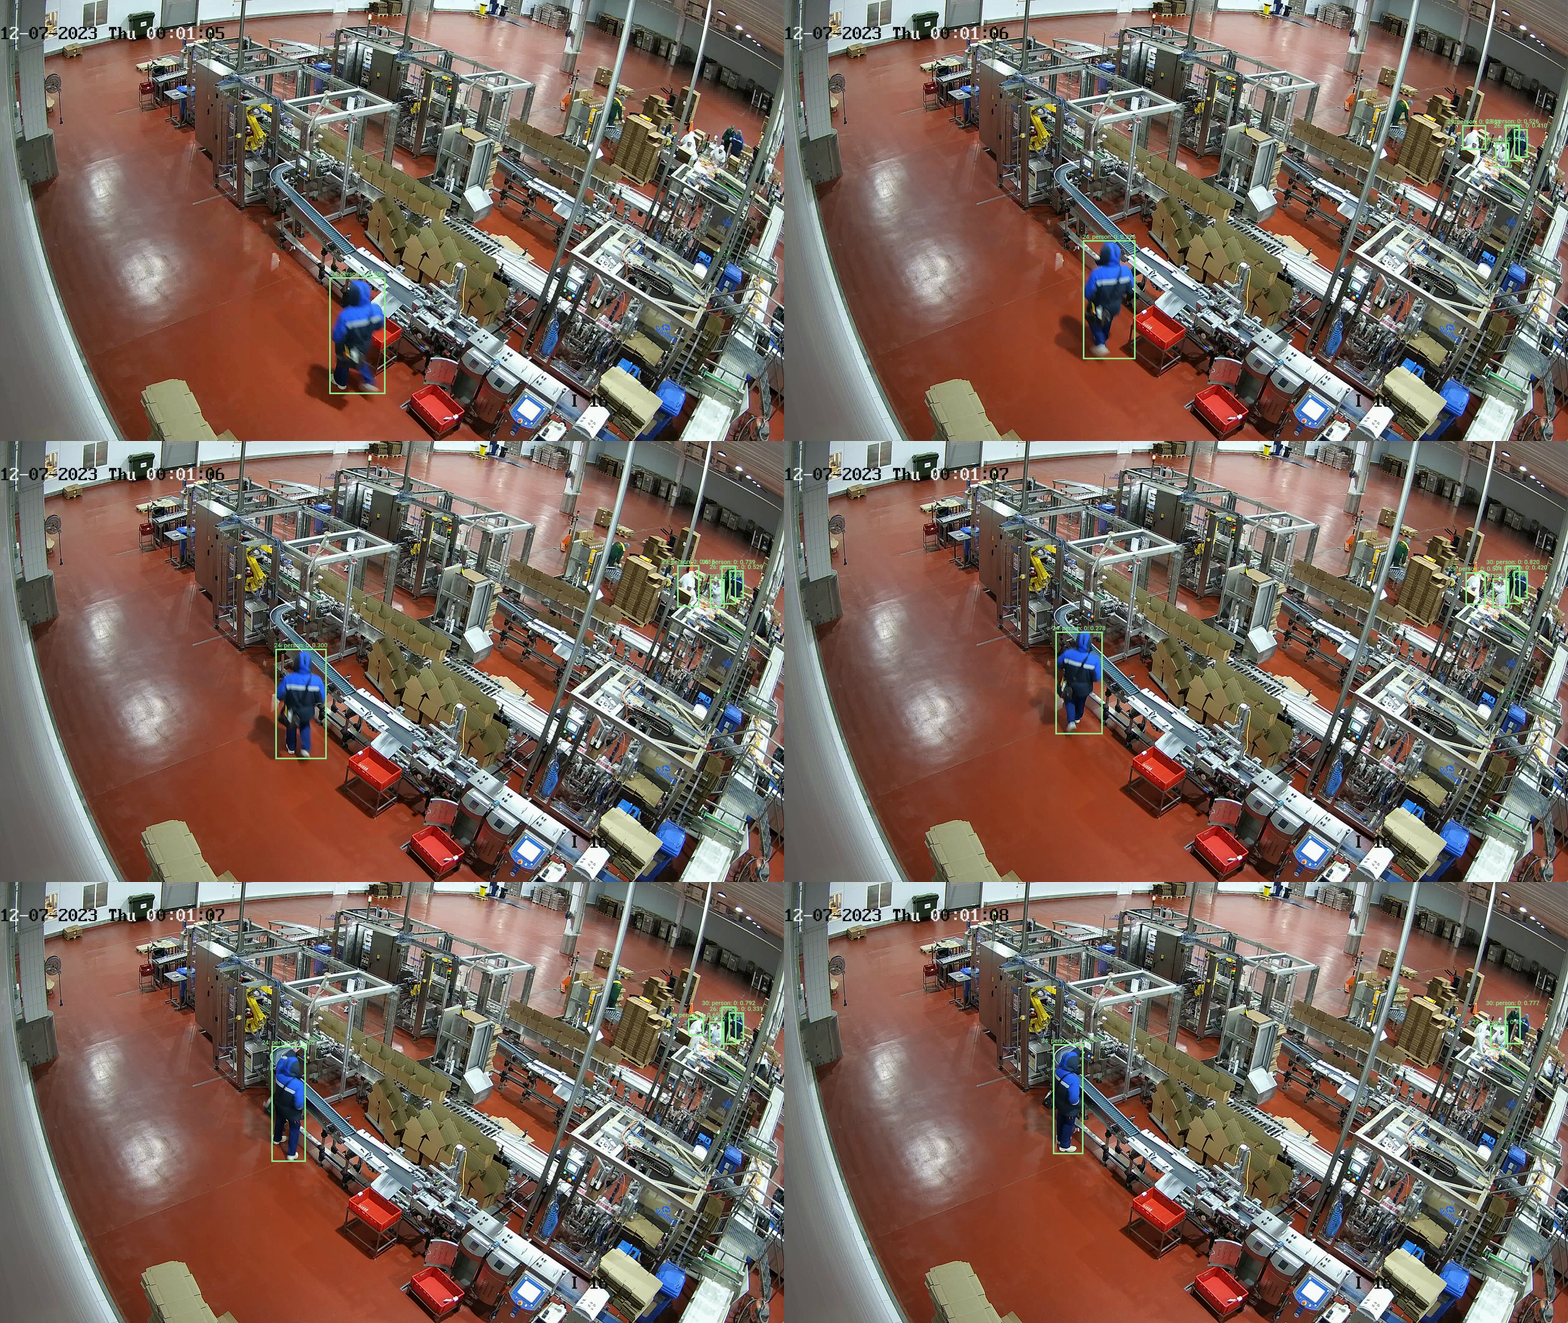
Աշխատակիցների տեղաշարժի հետևում տարբեր տեսախցիկներով և երթուղիների վերականգնում։
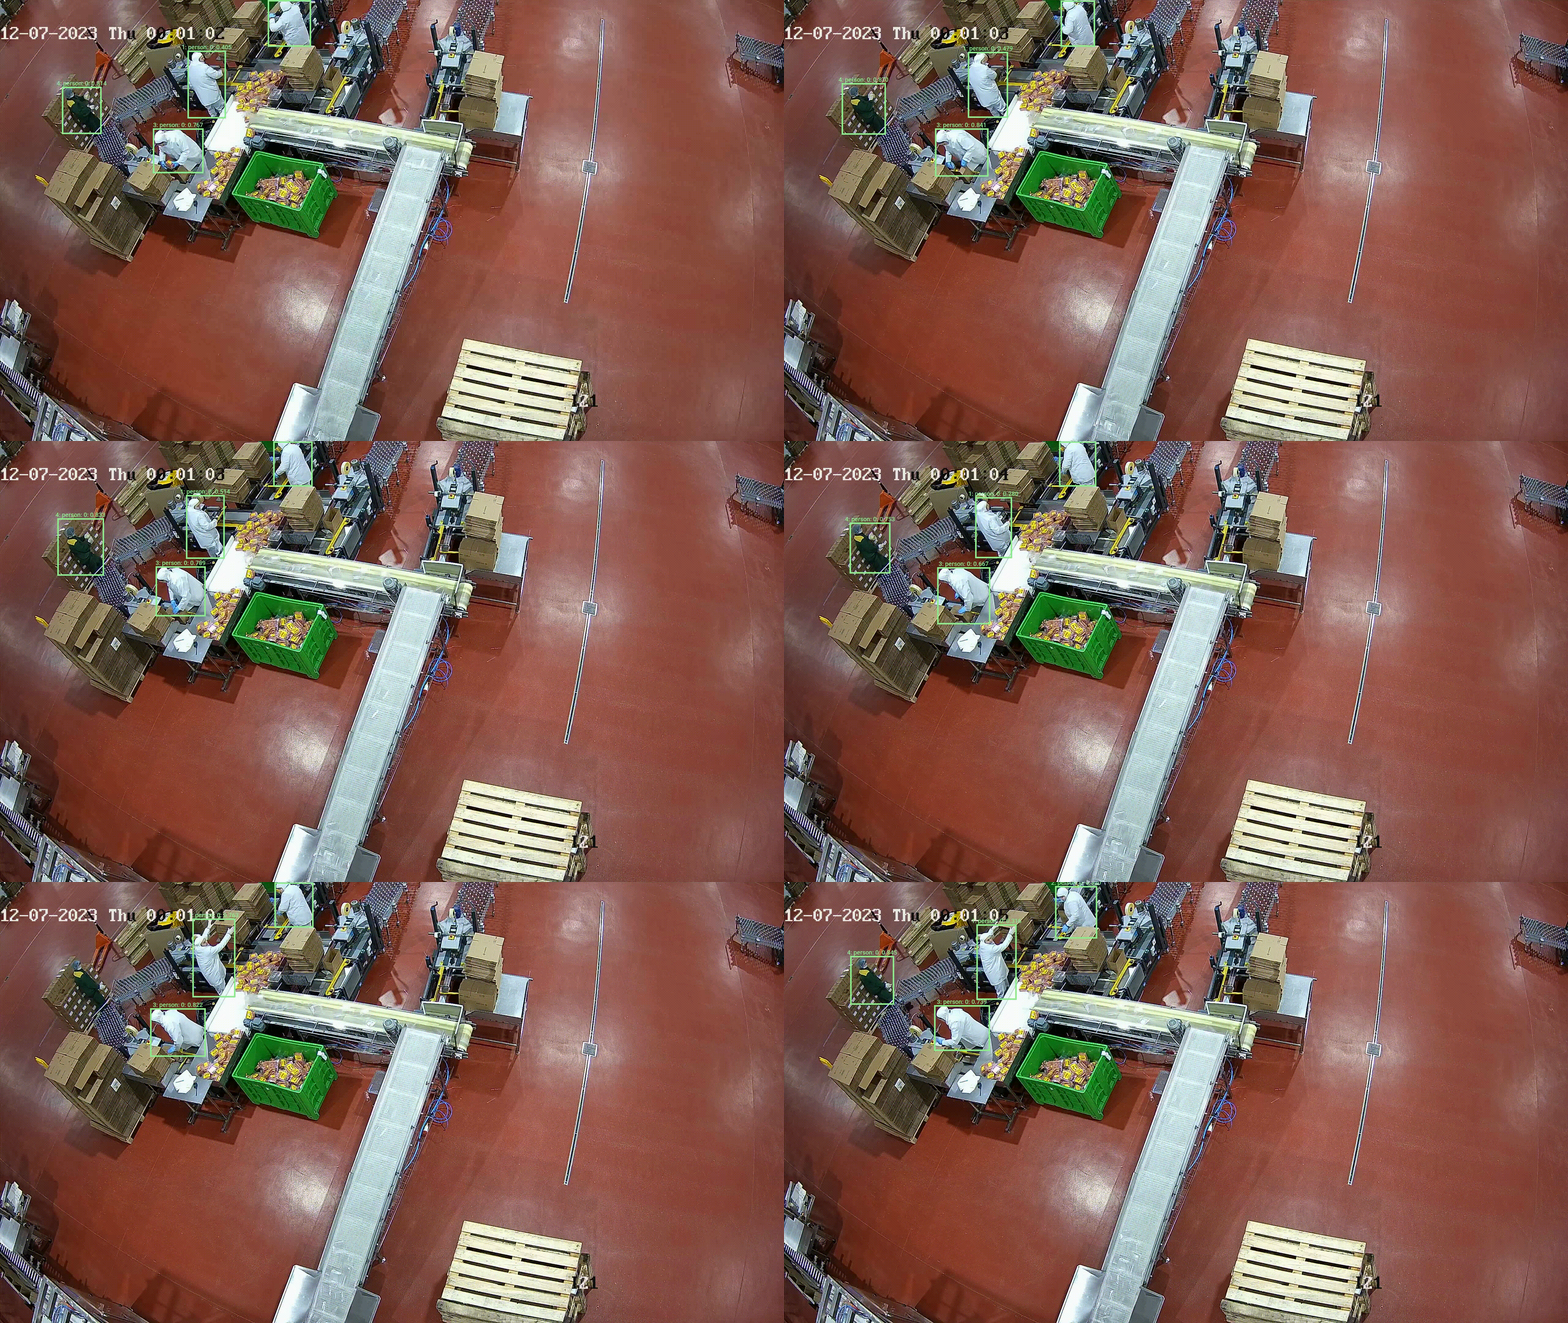
Գործողությունների ժամանակաչափում, հերթափոխերի համեմատում և ժամանակի կորուստների հայտնաբերում։
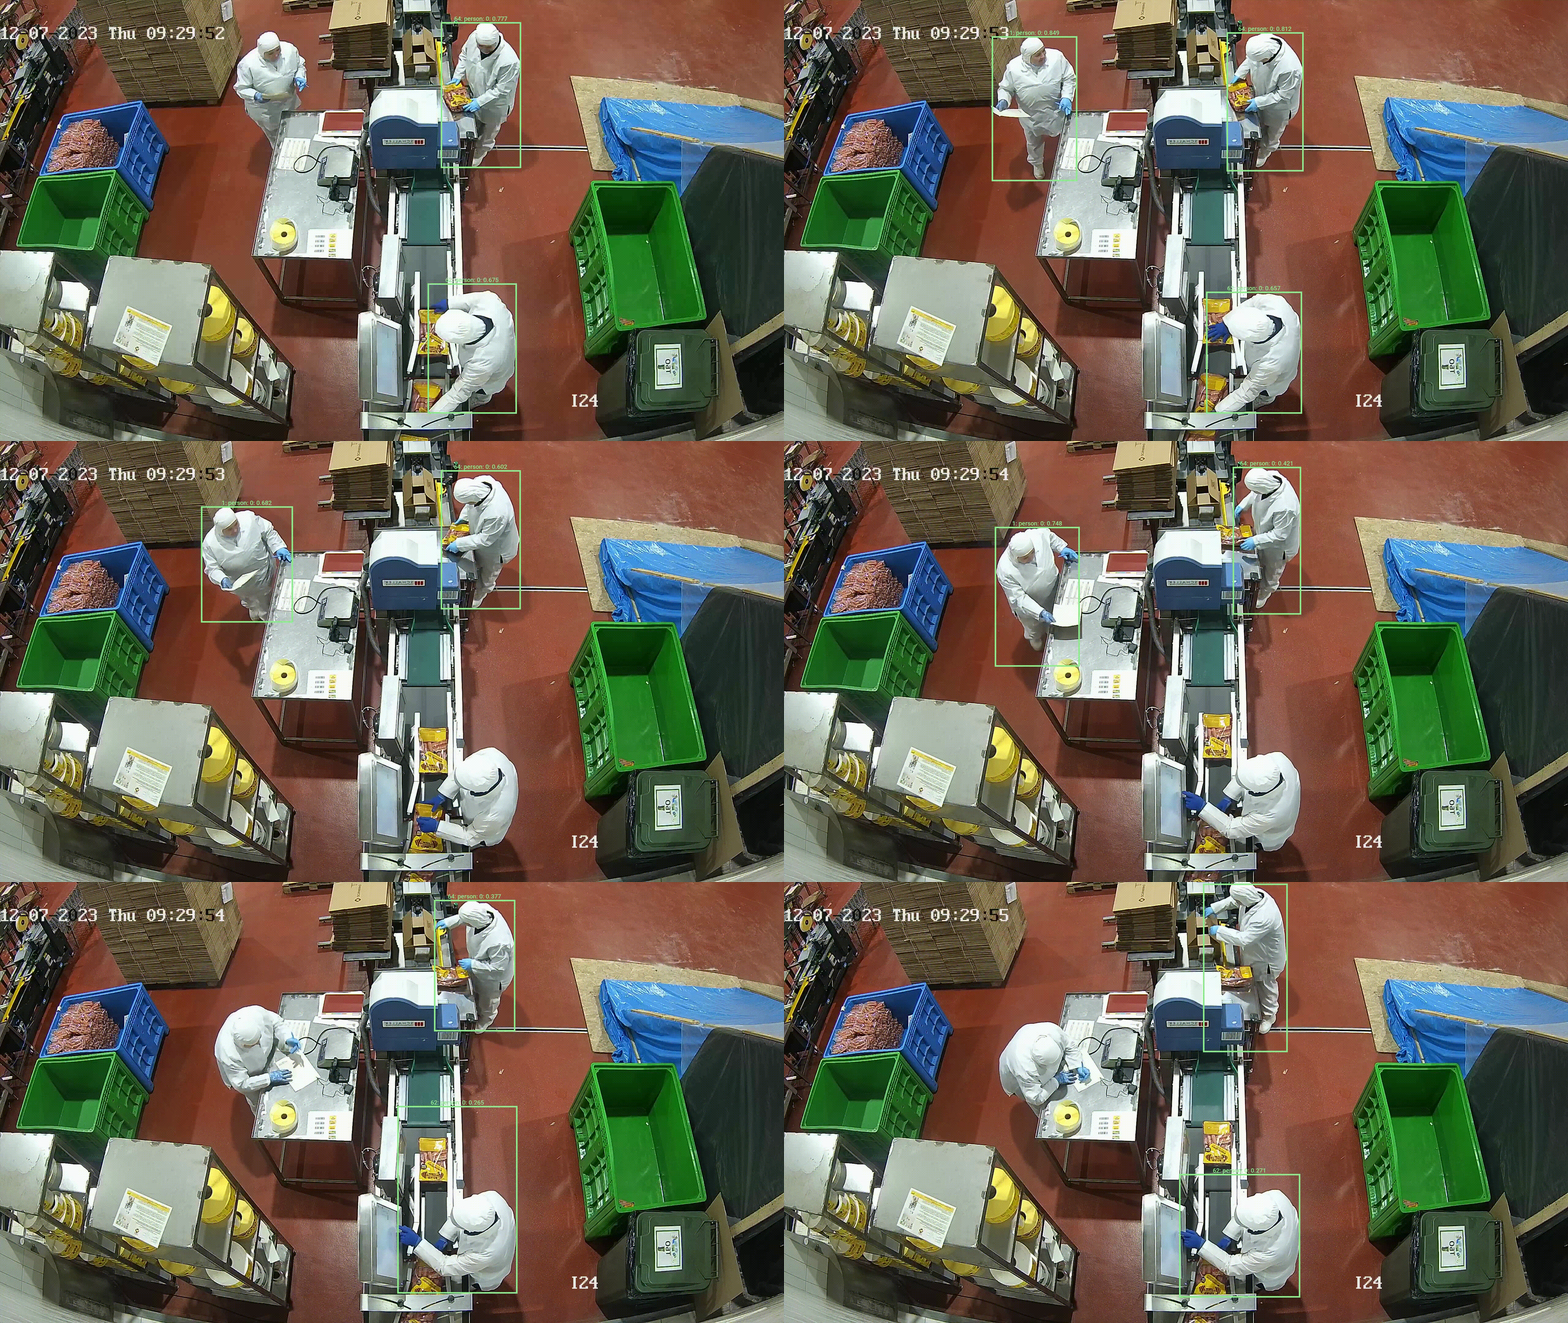
Գործողությունների, փուլերի և կանոնակարգերի կատարման ստուգում աշխատատեղերում։
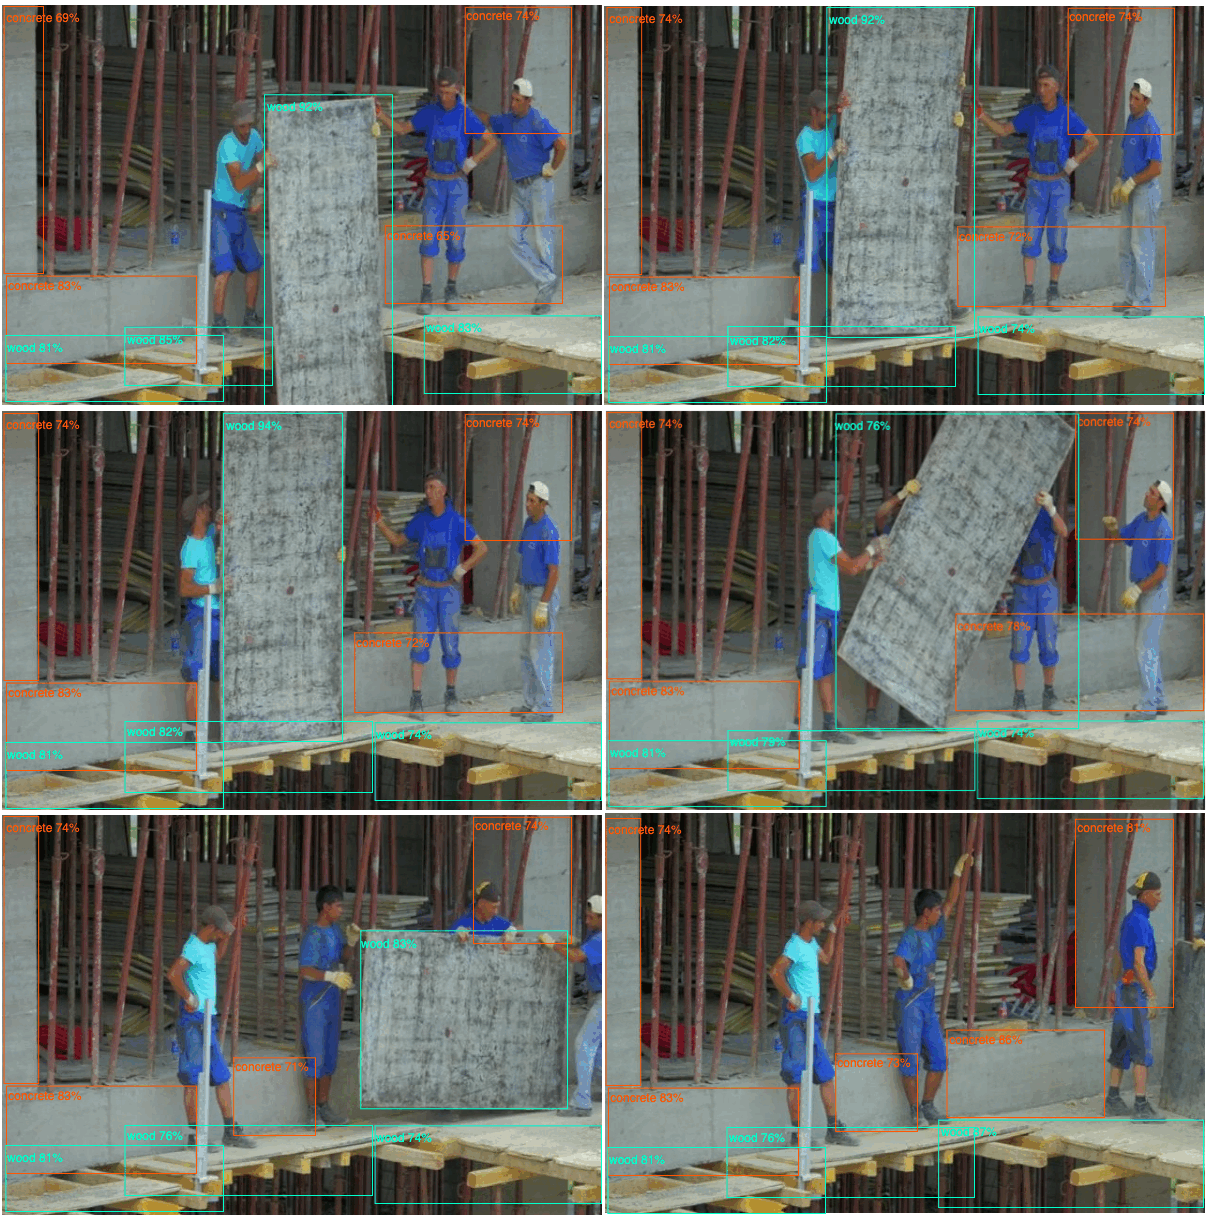
Աշխատակիցների գործողությունների, հրահանգների և հաջորդականության գնահատում։
Արտադրական գործընթացի մոնիթորինգ և շեղումների վաղ հայտնաբերում։
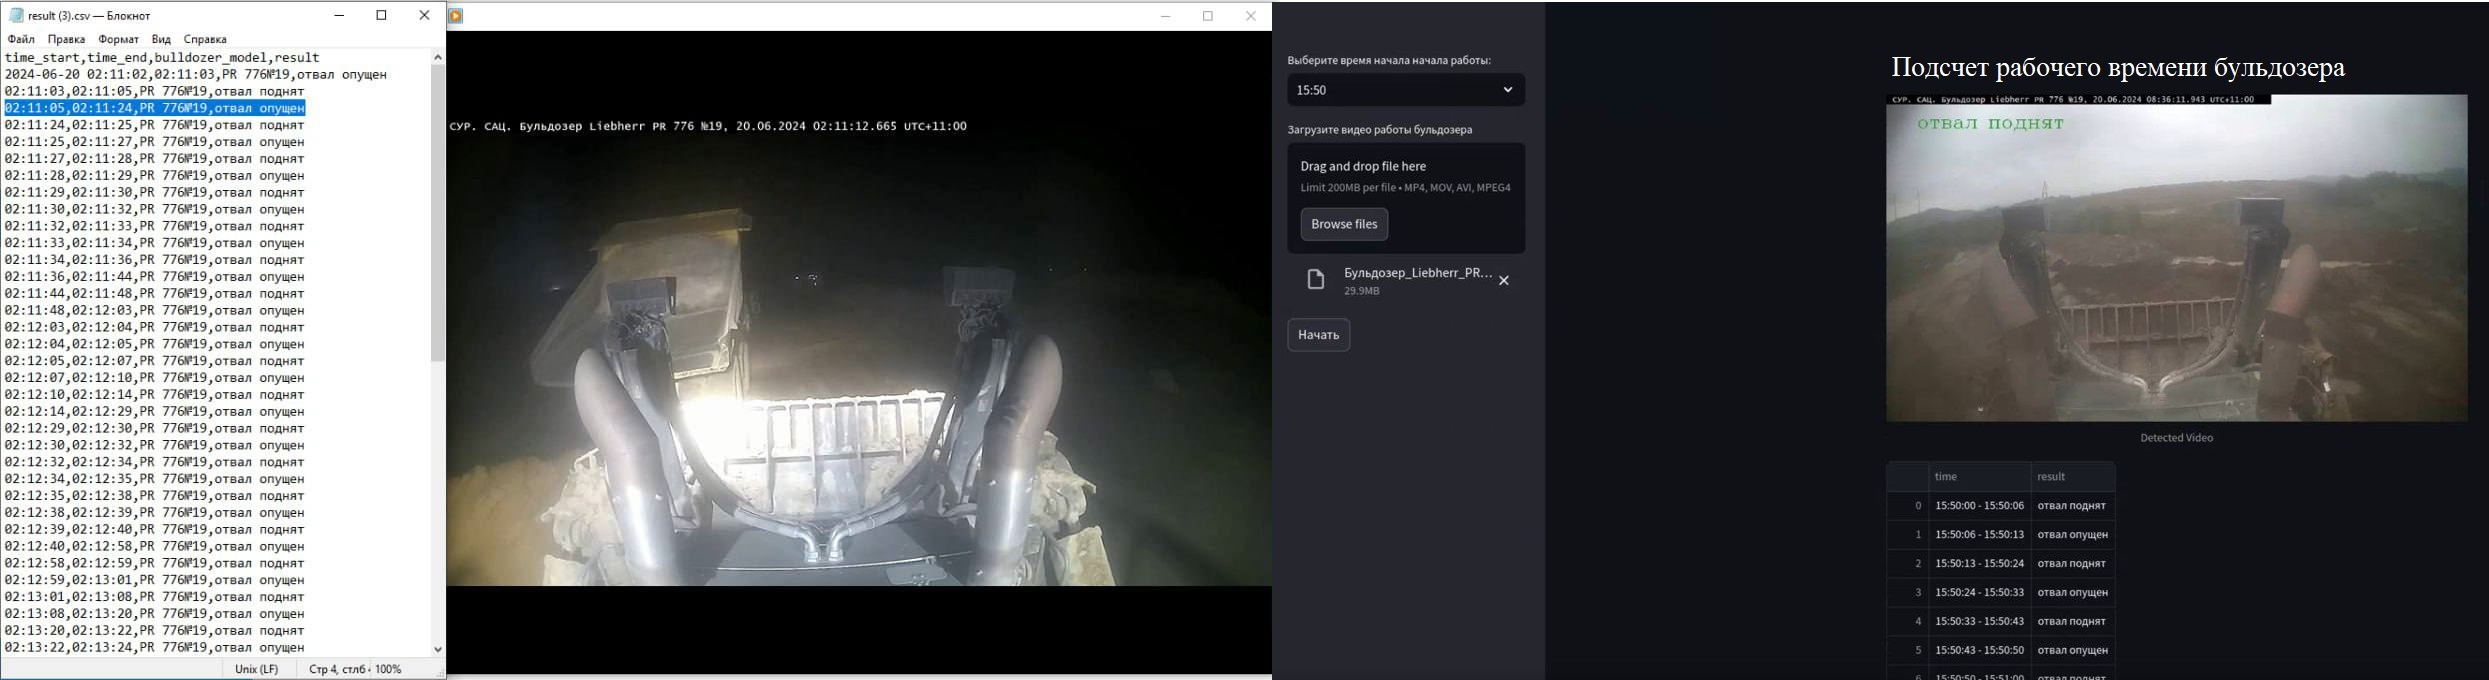
Տեխնիկայի ռեժիմների, պարապուրդների և փաստացի բեռնվածության մետրիկաների հավաքագրում։
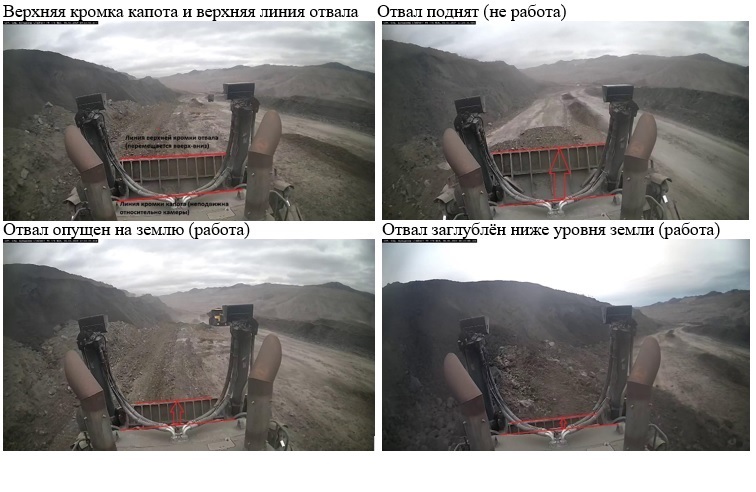
Բուլդոզերի և այլ տեխնիկայի ցիկլերի, ռեժիմների և արդյունավետության մանրամասն վերլուծություն։
Համակարգը ոչ միայն ֆիքսում է խախտումը, այլ կառուցում է իրադարձությունների շղթա՝ ով, որտեղ, որքան ժամանակ, ինչ օպերացիա և ինչպես է դա ազդում KPI-ի վրա։
Workplaces, stations, inspection routes, waiting, loading, assembly and quality control zones are configured.
The platform measures presence, activity, idle time, waiting, zone exit and operation duration.
Events are linked to context: missing material, equipment wait, phone, conversation, crowding or route violation.
Results go to dashboards, reports, notifications, motivation, training and standard time adjustment.
Խոշոր տարածքներում պետք է տեսնել ոչ թե մեկ տեսախցիկ, այլ աշխատակցի կամ բրիգադի ամբողջ ուղին։ ReID-ը և multi-camera tracking-ը օգնում են վերականգնել երթուղին և հաշվել ժամանակը գոտիներում։
Գործնականում աշխատանքի վերլուծությունը առանձին չի ապրում․ հեռախոսը ձեռքին, ՍԻԶ-ի բացակայությունը, վտանգավոր գոտին կամ սարքավորման պարապուրդը ազդում են արտադրողականության և ռիսկերի վրա։
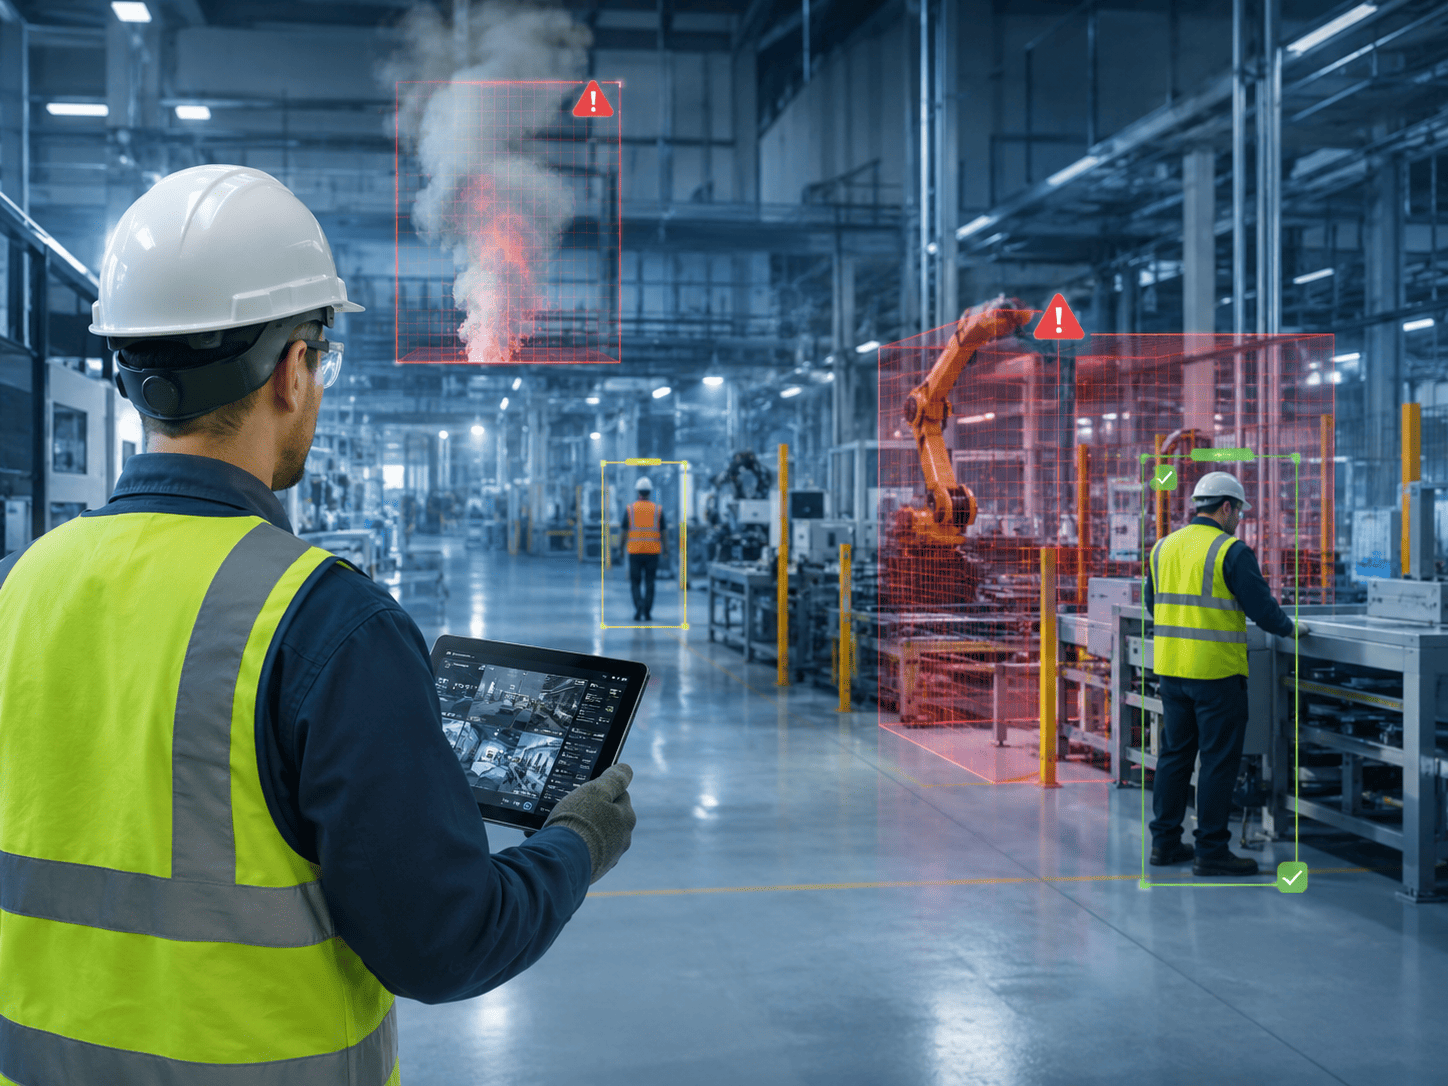
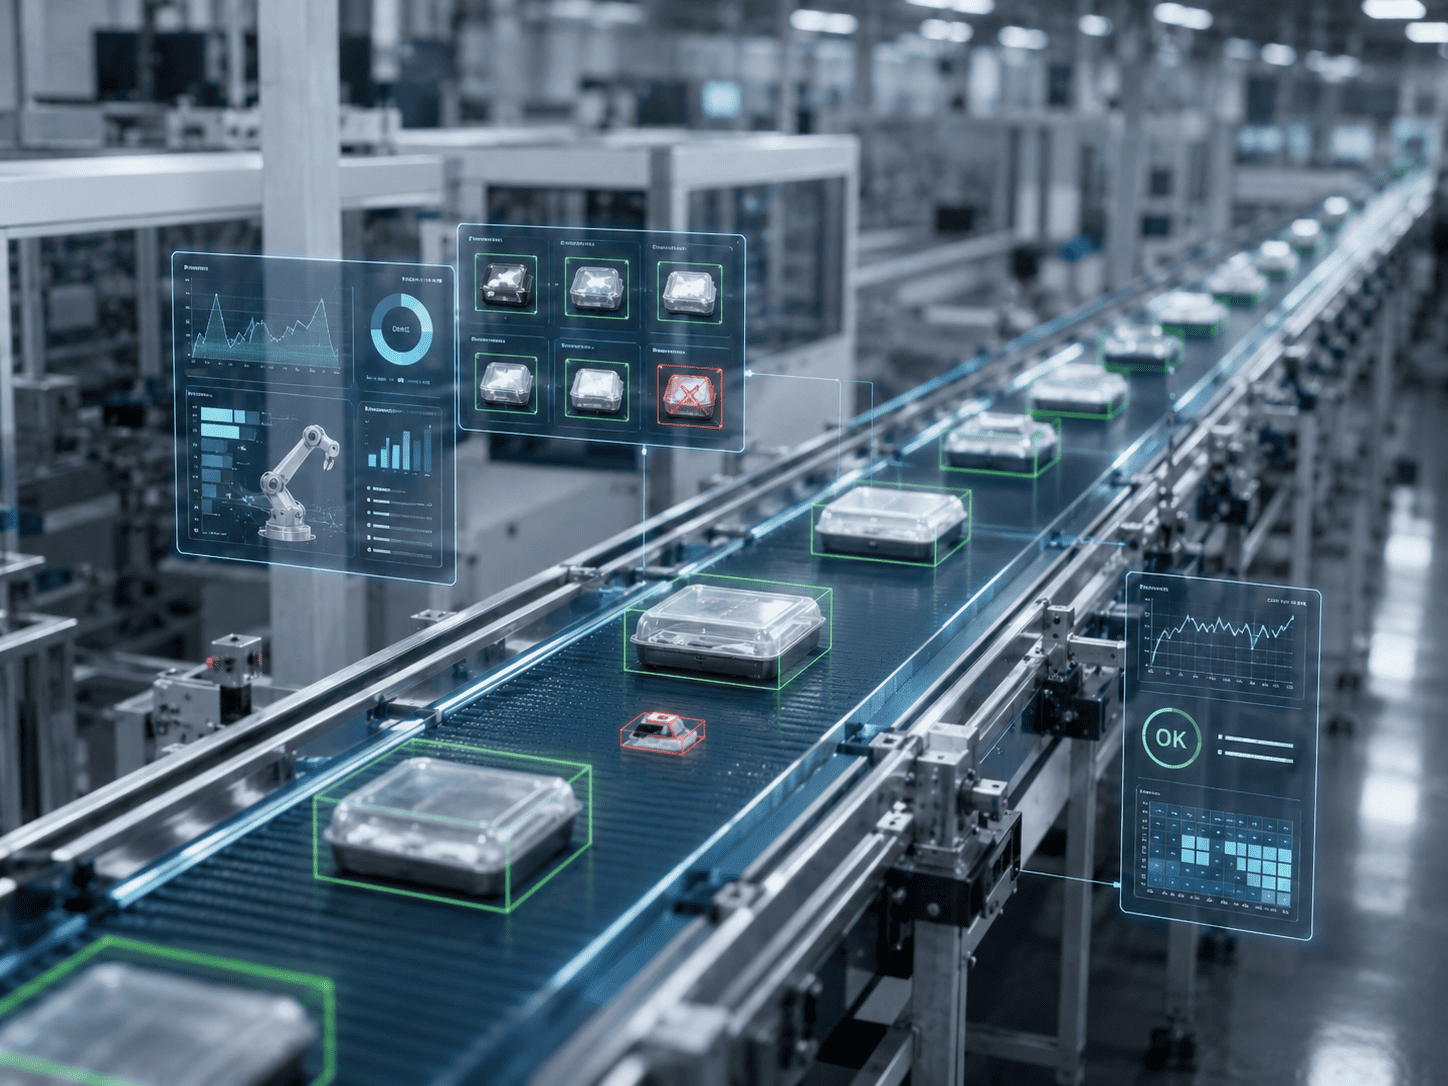
Արդյունաբերական անվտանգության հարթակի ոճով՝ օպերատորը տեսնում է իրադարձությունները, ղեկավարը՝ KPI, վերլուծաբանը՝ շեղումների պատճառները։
Shift, area, employee, downtime, attendance and workload KPI.
Activity, routes, downtime, bottlenecks and work density across the site.
Every deviation is linked to a frame, time, zone, employee or group.
Comparison of shifts, teams, contractors, areas and improvement dynamics.
Լուծումը կարելի է գործարկել cloud, on-premise կամ hybrid ձևաչափով։ Պիլոտի համար սովորաբար բավարար է միացնել գործող IP տեսախցիկները և ընտրել գոտիները։
RTSP / ONVIF connection, work with archive and current video surveillance system.
Deployment inside customer infrastructure, on edge server or in hybrid architecture.
ERP, MES, SCADA, ACS, BI, Active Directory, Telegram, email, API and webhooks.
Adding new scenarios, zones, detectors and business rules as the project evolves.
Սկսենք պիլոտից մեկ գոտում կամ գծում՝ կարգավորենք սցենարները, ցույց տանք իրադարձությունները, հաշվետվությունները և ազդեցության հաշվարկը։