Flows and footfall
People counting by entrances, floors, atriums, and leased areas, peak hours, movement directions, recurring peaks after events, and seasonal patterns.

A unified AI platform for traffic, queues, safety, parking, and operational metrics. It helps you see real visitor flows, respond to incidents quickly, and manage the property at the level of executives, security, and operations teams.
monitoring of flows, queues, incidents, and service areas without increasing headcount
works with the installed video surveillance / VMS infrastructure and does not require full equipment replacement
safety, traffic, marketing analytics, and operational metrics are combined in one system
scales from one mall to a property network with a unified control and reporting center
In video analytics for malls and mixed-use complexes, four areas are most in demand: visitor traffic, queues and service quality, safety in common areas, and the transport perimeter. We combine them into one platform and show not just video archive, but events, notifications, heatmaps, metrics, and reports by zones, floors, shifts, and properties.
People counting by entrances, floors, atriums, and leased areas, peak hours, movement directions, recurring peaks after events, and seasonal patterns.
Queues at food courts, checkouts, cinemas, information desks, cloakrooms, children’s and entertainment zones — with notifications and waiting-time statistics.
Crowding, aggressive behavior, fights, falls, unattended objects, blocked exits, violations in service areas, and evacuation-route monitoring.
Vehicle traffic, entrance queues, parking occupancy, zone load, pedestrian routes from parking to entrances, and bottlenecks near barriers.
Functionality can be launched step by step: entrances and common areas first, then queues, food court, cinema, parking, and a unified management dashboard.
Counting by entrances, floors, wings, tenants, and key zones with statistics export and period comparison.
Heatmaps, dwell time, movement routes, and analysis of interest in storefronts, atriums, navigation, advertising surfaces, and promotions.
Queue length and waiting-time monitoring with thresholds and notifications for food courts, cinema, cloakrooms, and service desks.
Crowding, dangerous density, fights, falls, unattended objects, blocked passages, and other critical situations in public areas.
Comparison of floors, galleries, entrances, event areas, and tenants by footfall, load, and response to promotions.
Monitoring of entrance groups, service corridors, escalators, elevator halls, evacuation exits, and technical rooms.
Vehicle traffic, parking occupancy, entrance queues, lane occupancy, wrong-way movement, and bottlenecks.
Event log, incident cards, network dashboards, priority notifications, and unified metrics for the management company.
Video becomes a source of management data: it shows where traffic is lost, where queues appear, which zones are overloaded, and where safety requires a faster response.
accurate traffic, peak hours, comparative load, entrance share, and weekday dynamics
queue length, waiting time, threshold breaches, and the effect of staff schedule changes
crowding, flow density, event spikes, risk zones near escalators, exits, and narrow passages
vehicle traffic, area occupancy, peak periods, entrance queues, and correlation with indoor mall traffic
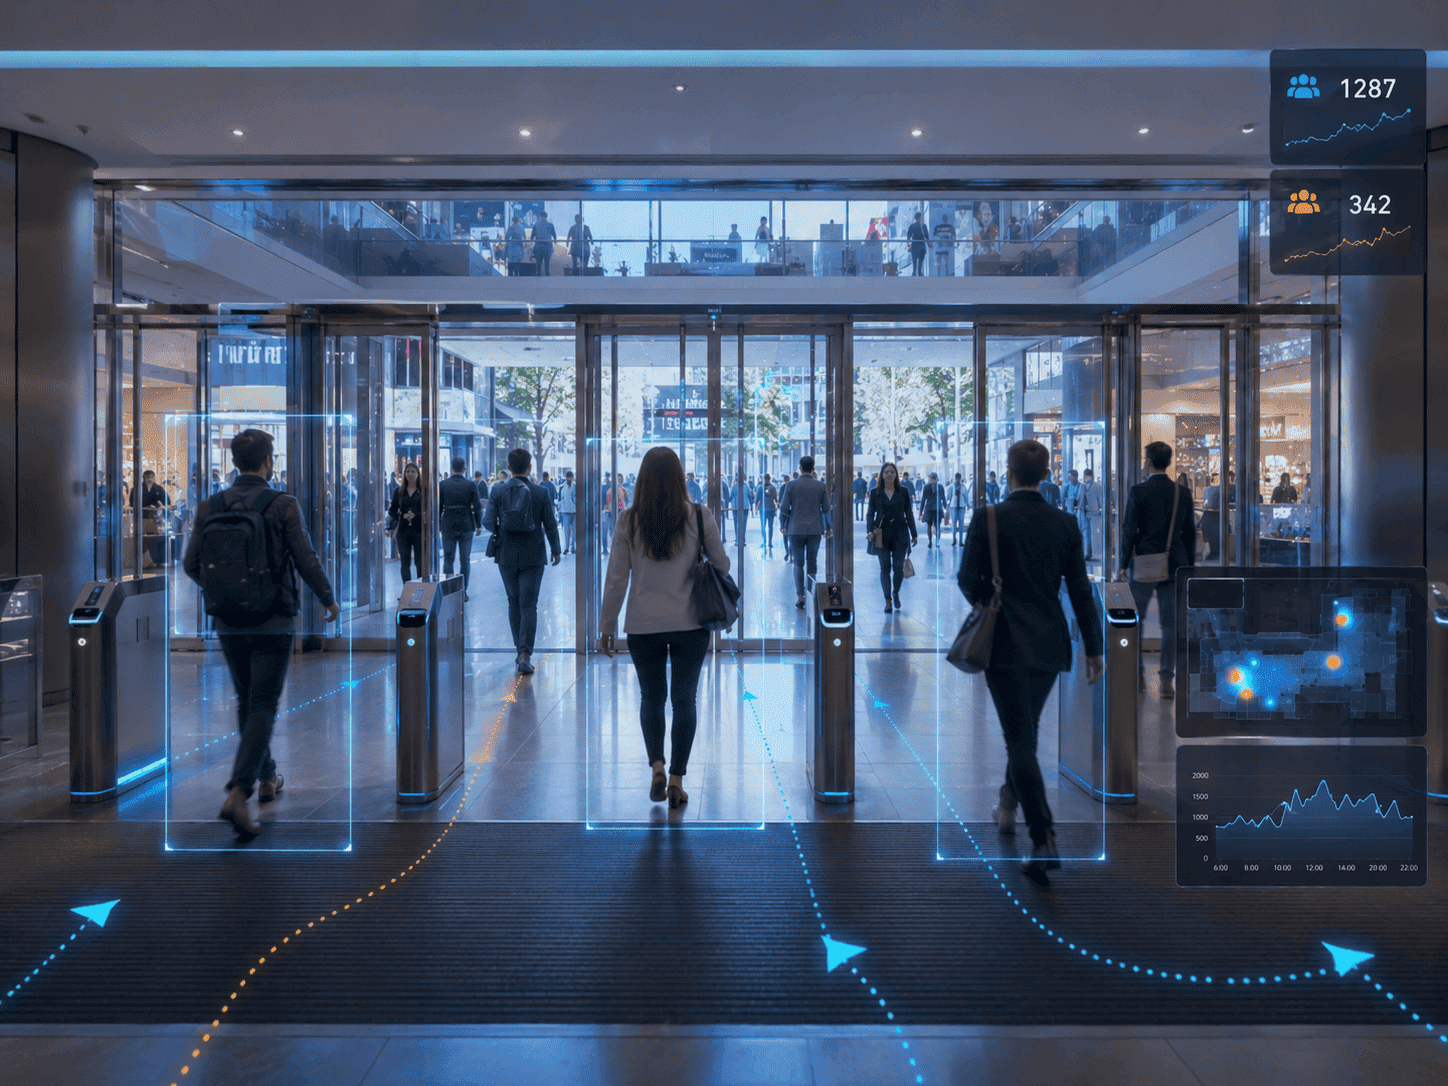
The system counts flows at entrances and exits, tracks distribution by floor, builds heatmaps, and helps understand how visitors move through the property: which entrances are overloaded, which galleries underperform, where people stay longer, and how behavior changes during promotions, sales, and events.
This is useful for both the management company and marketing: you can measure campaign impact, compare zones, and make decisions about navigation, advertising, tenant mix, and staffing.
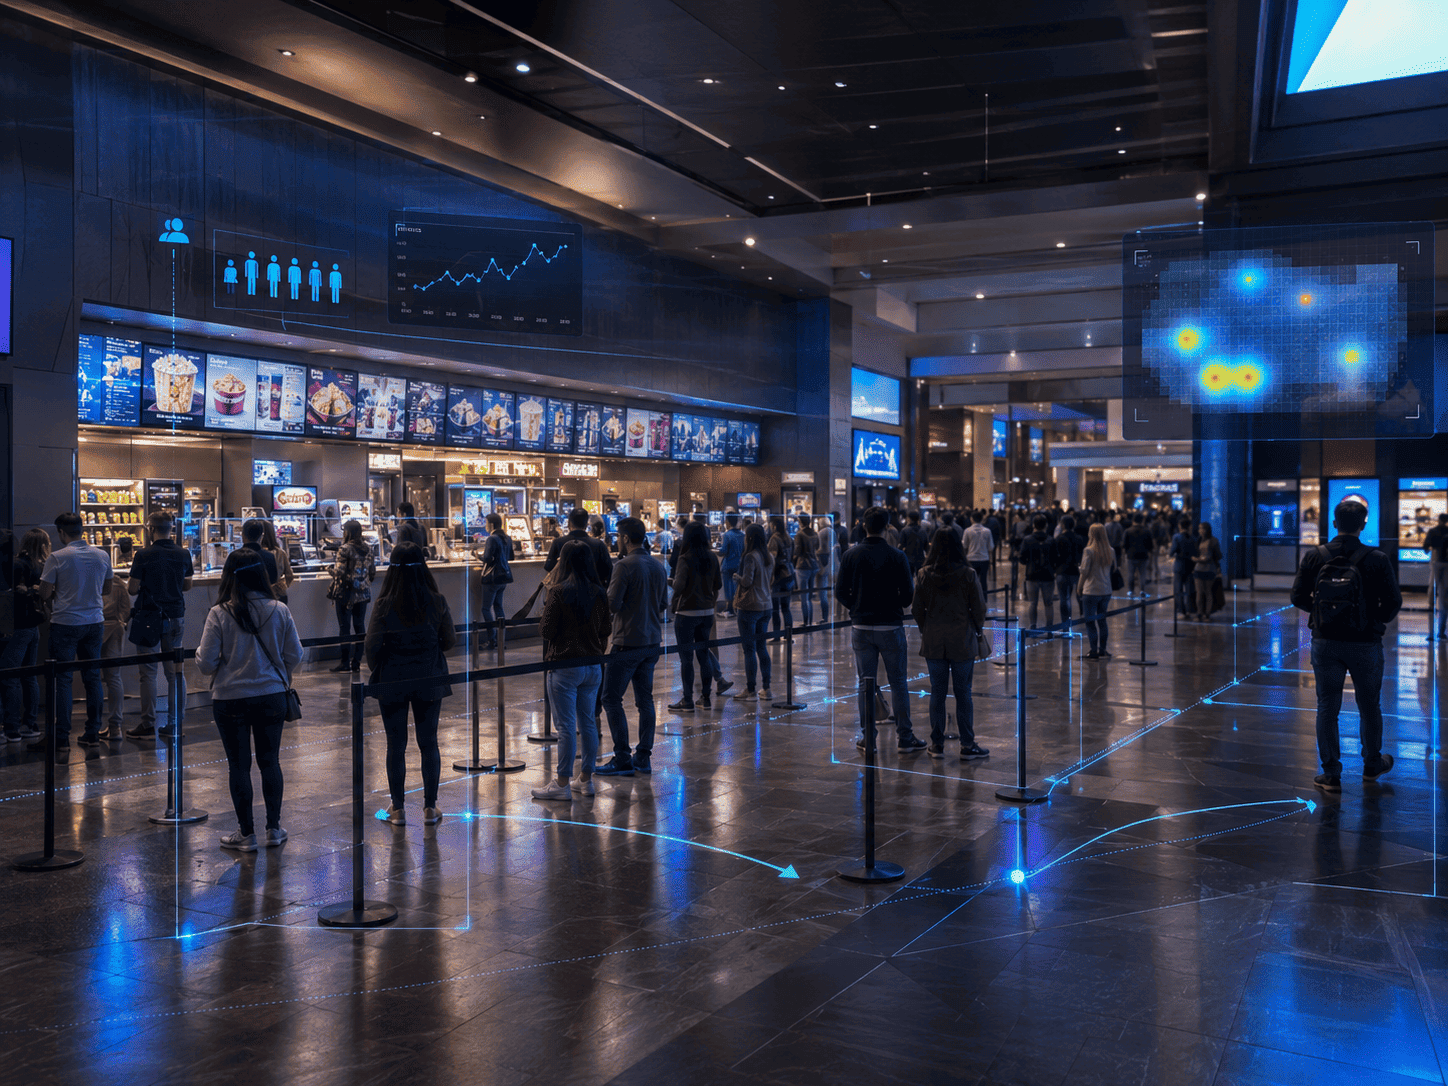
Video analytics measures queue length and waiting time at checkouts, food outlets, cinemas, children’s areas, information desks, and cloakrooms. When thresholds are exceeded, the shift manager receives a notification, and the report keeps the full history: when peaks occurred, how quickly the team responded, and how the load changed by zone.
This helps plan staff schedules more accurately and open additional service lines faster without constant manual inspections.
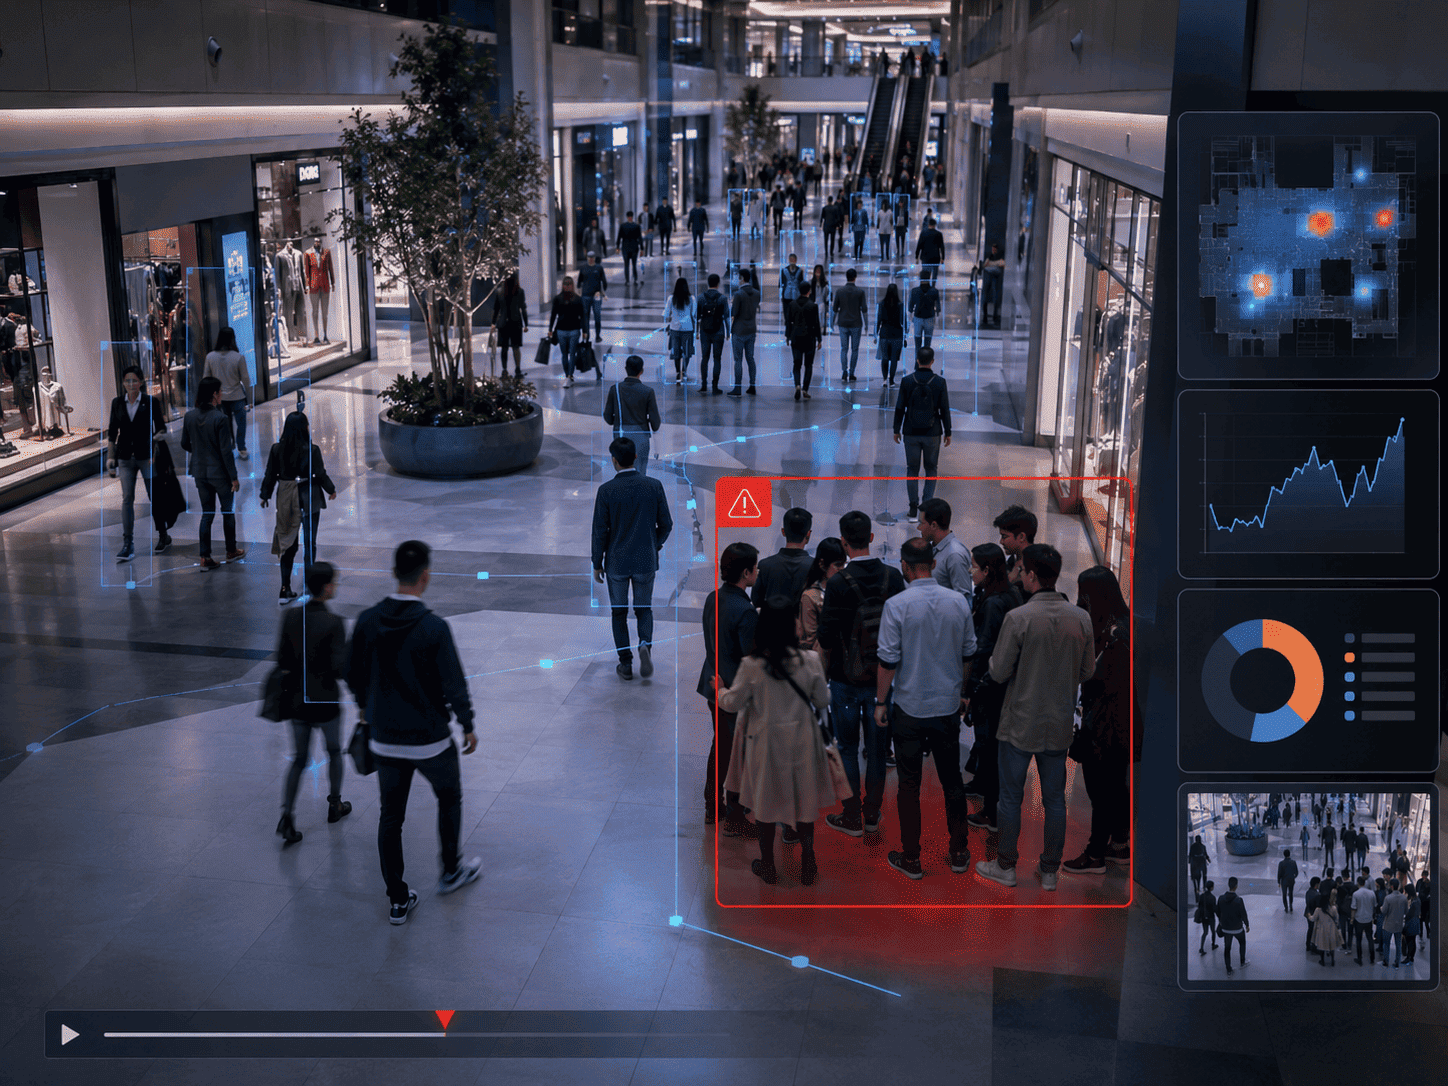
For a shopping mall, traffic statistics are not enough. Fast response matters in situations where safety can deteriorate within minutes: crowding near stages and escalators, conflicts, falls, unattended items, blocked passages, overloaded evacuation routes, or abnormal behavior in common areas.
Video analytics identifies such events, creates an incident card, and sends a notification to the operator, security team, or duty shift.
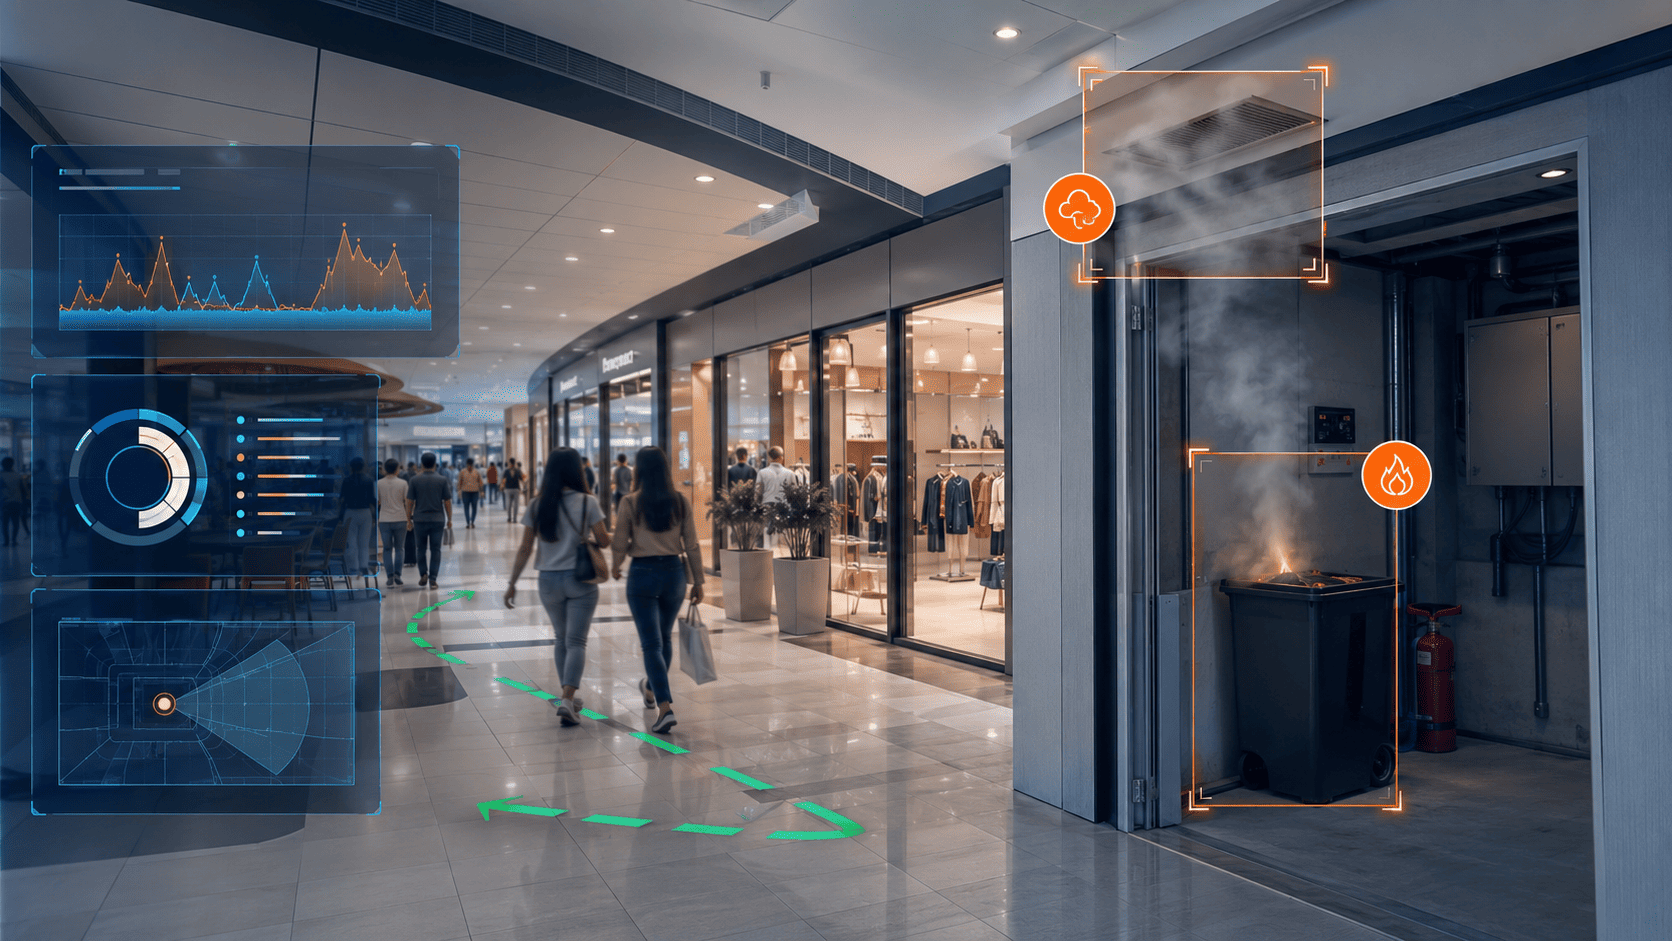
For shopping malls, it is important to detect not only people-related events, but also early fire indicators: smoke near the ceiling, small ignition sources, equipment overheating and smoke in technical or service areas.
Video analytics complements fire automation with visual confirmation: the operator receives an event, snapshot, area and risk type, while operations teams can check the source and keep evacuation routes clear faster.
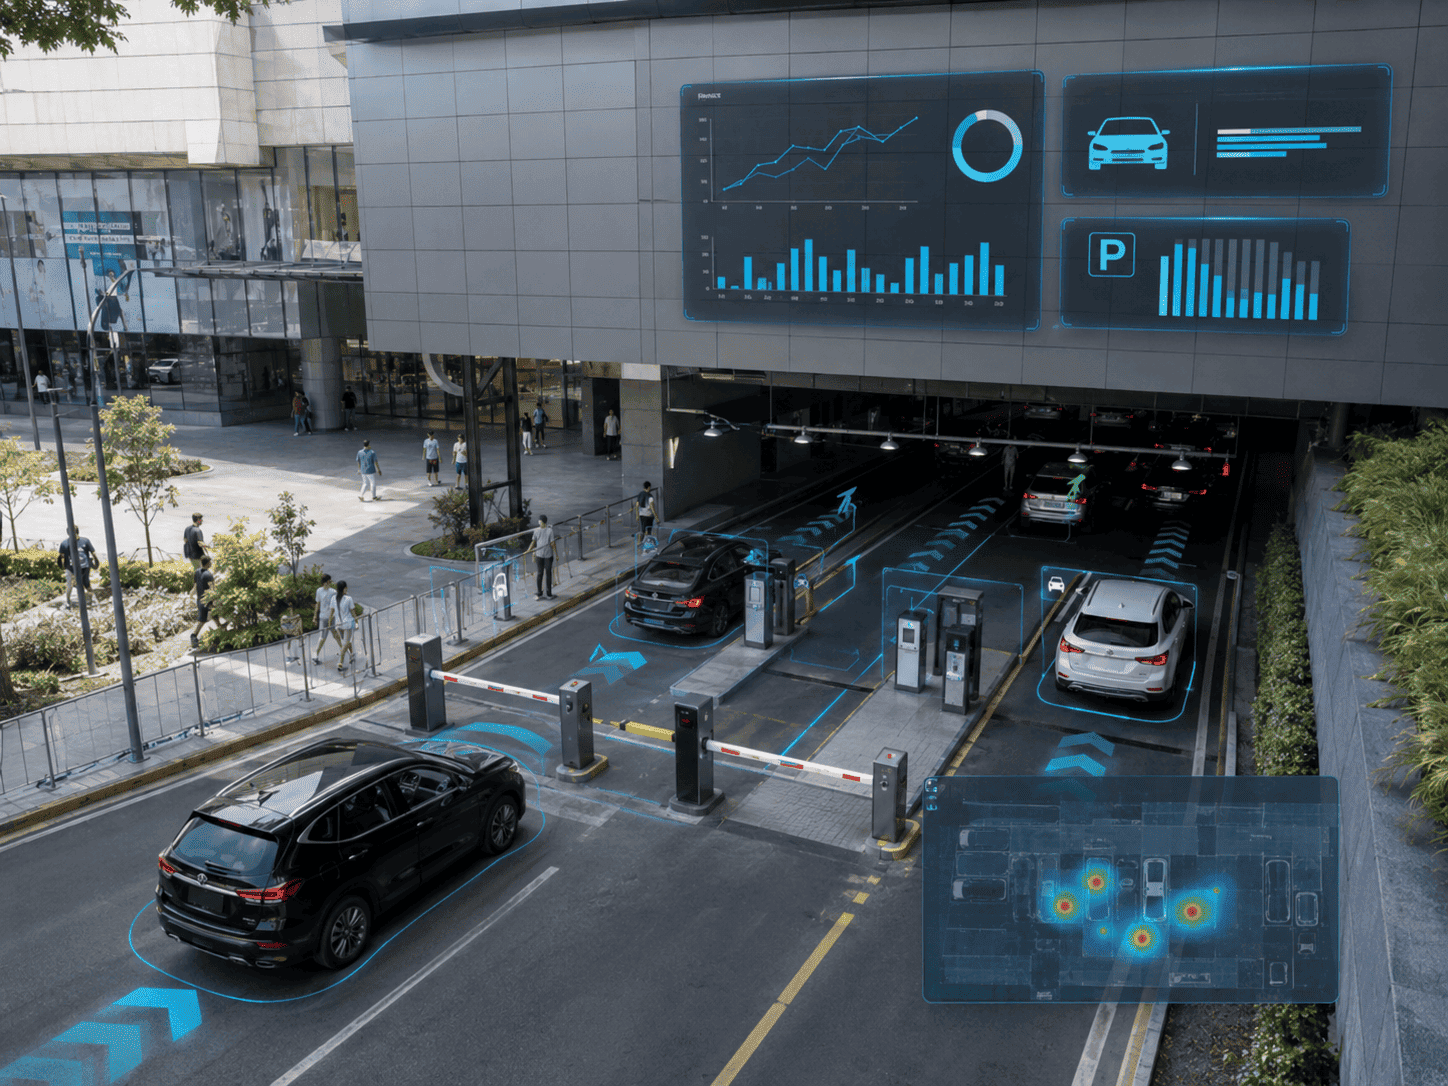
At access roads and parking areas, the system counts vehicles, monitors lane load, detects entrance queues and abnormal stops, and helps synchronize the transport perimeter with visitor flows inside the property. For large malls, this is especially important on weekends, event days, and seasonal peaks.
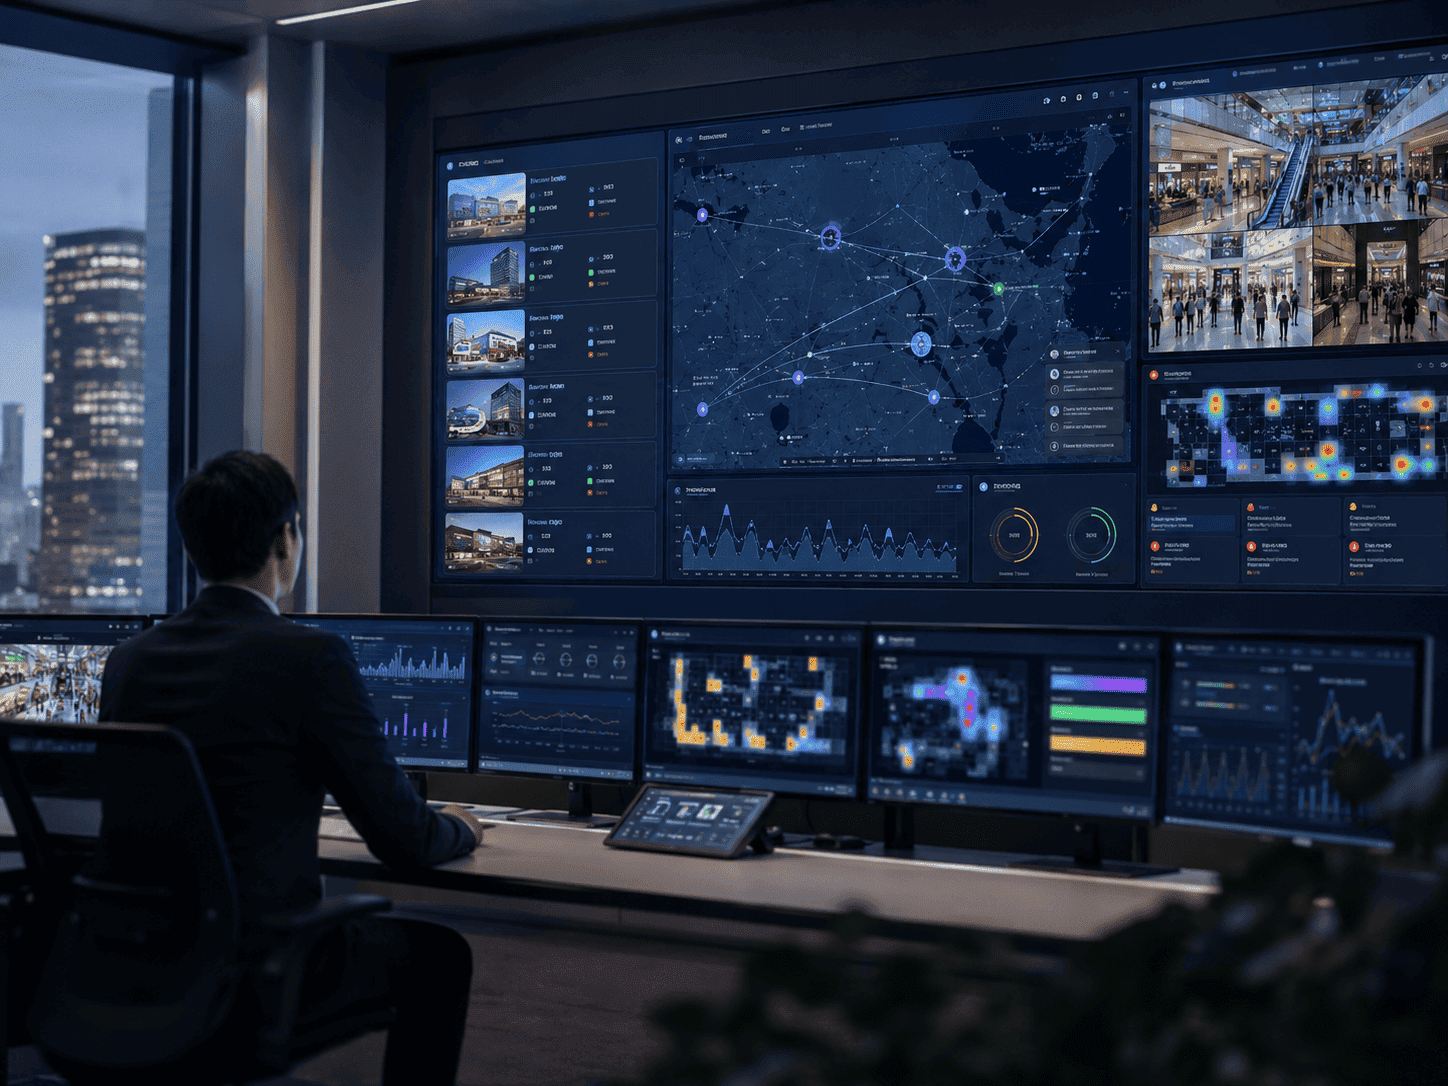
The platform combines data from all cameras and analytics scenarios: flows, queues, parking, safety, events, and service metrics. Executives see each property’s status, deviations from key metrics, and can compare malls, clusters, shifts, and time periods without manual consolidation.
Video analytics for malls is useful far beyond security. It gives the property a shared digital picture and helps different teams make decisions based on the same facts.
A project usually starts with the clearest zones: entrances, common galleries, food court, cinema, or parking. After the effect is confirmed, coverage can be expanded by floors, functions, and network properties.
Select 1–2 applied scenarios: flow counting, queues, crowd analytics, or parking. Connect existing cameras.
Configure the dashboard, notifications, event log, reporting, and, if needed, integrations with VMS, BI, service desk, and internal systems.
Extend analytics to new zones, floors, and properties. Build a unified control center for the mall network.
We will help choose the fastest-impact scenarios: entrance groups, queues, crowd monitoring, parking, or a unified dashboard for the management company.